Pupil-teacher ratio: quality versus the pressure of numbers
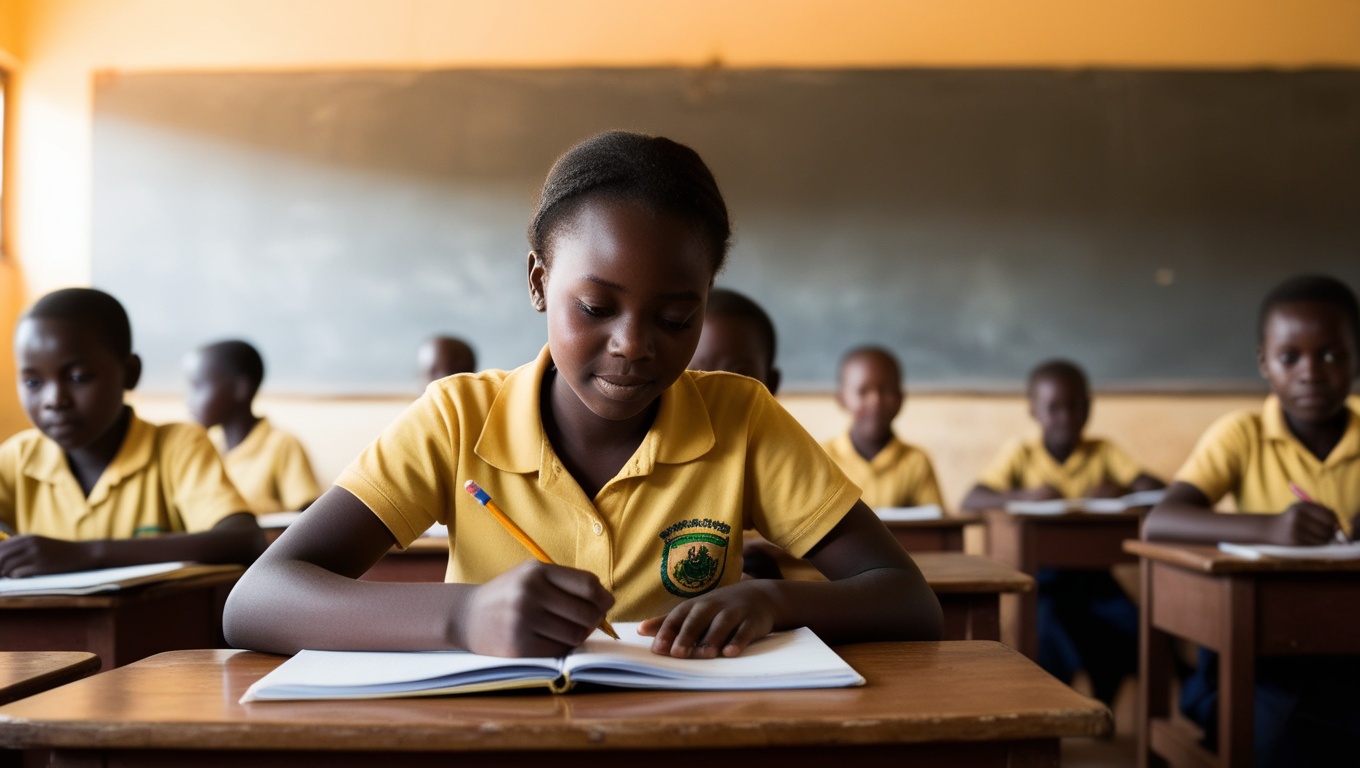
In a Beninese classroom, a teacher facing 39 pupils has, over a one-hour lesson, barely more than a minute of individual attention per child. In neighbouring Ghana, the same teacher would face 27, almost half as much again per head. This gap, which looks merely arithmetic, is in fact the distilled result of decades of public-policy choices. The pupil-teacher ratio condenses into a single figure the tension between the ambition of universal schooling and the reality of human resources. In West Africa this tension is acute: primary enrolment now approaches 90 %, yet sub-Saharan Africa remains the region where classroom pressure is highest in the world. And the stakes are not abstract: 89 % of 10-year-olds there are in learning poverty, unable to read and understand a simple text (World Bank, 2022). CRAD offers a reading of this data, its causes, and the levers of action available to decision-makers.
A simple indicator, sharply contrasting realities
The pupil-teacher ratio does not measure everything (it ignores effective class size, multigrade teaching and absenteeism), but it remains a robust proxy for the pressure bearing on the classroom. The higher it is, the scarcer individual attention becomes and the more learning quality is threatened. World Bank data (2018, the latest regionally comparable point) place Côte d'Ivoire (41.8) and Togo (40.2) at the top of the scale, while Ghana stands out clearly at 27 pupils per teacher. Between these two extremes, Burkina Faso (39.7), Benin (39.2), Mali (37.8), Niger (36.3) and Senegal (36.3) form a tight pack, still far from pedagogical comfort. The amplitude is striking: at comparable school populations, a Ghanaian pupil and an Ivorian pupil experience supervision conditions that vary by a factor of more than one and a half.
Ghana: proof that this is not a fatality
The first lesson the data teaches is that no demographic determinism locks the region in. Ghana and Benin share similar constraints (sustained growth of the school-age population, limited budgets, now near-universal primary enrolment), yet their trajectories have diverged over the past fifteen years. Ghana was already at 31 pupils per teacher in 2010; it kept falling to 27 in 2018, consolidating a system already among the best-performing in the sub-region. Benin, starting from a much higher level (46.4 in 2010), began a genuine catch-up to reach 39.2 in 2018. The gap between the two countries narrowed, but it still amounts to more than twelve pupils per class in Ghana's favour, which concretely changes the pedagogical situation.
The Beninese case deserves attention, because it shows that improvement is possible but neither linear nor guaranteed. The ratio fell from 46.4 in 2010 to 39.2 in 2018, a gain of more than 7 points in eight years. The trajectory, however, remains uneven: after an upturn in 2012-2013, the indicator climbed back to 45.9 in 2014 before falling again, then saw a fresh rebound in 2017 (43.6). This volatility is not anecdotal: it signals teaching capacity built through budgetary swings and recruitment waves rather than through stabilised multi-year planning. A system that advances this way can just as easily slide back.
Why the pressure does not ease: breaking down the causes
If the ratio is so resistant, it is because it is the net result of three forces that often pull in opposite directions. The first is school-age demographics: with population growth of 2.4 to 4 % per year in the region and primary enrolment now close to 90 %, the number of children to educate rises faster than in almost any other region of the world. Reducing the ratio therefore first means running simply not to fall behind. The second force is the recruitment flow, itself constrained by national budgets under strain. The third, often overlooked, is attrition: the teachers who leave the profession. And this has deteriorated markedly. Globally, the attrition rate of primary teachers has nearly doubled, from 4.62 % in 2015 to 9.06 % in 2022 (UNESCO, Global Report on Teachers, 2024), with departures most often occurring within the first five years of a career. Every teacher who leaves must be replaced before the pressure on classes can even begin to ease.
These three forces explain why a visible recruitment effort can translate into a disappointing improvement in the indicator. To steer the ratio, one must therefore act simultaneously on:
- The inflow: recruit in sufficient volume to absorb the growth in pupil numbers, not merely to fill the existing gap.
- The outflow: retain early-career teachers, where attrition concentrates, through adequate working conditions, pay and support.
- The distribution: deploy teachers where pressure is greatest, because an acceptable national average can mask overcrowded rural classrooms.
- Qualification: ensure that recruitment genuinely raises the level of supervision, rather than simply inflating a poorly trained workforce.
Three national trajectories, three steering models
Comparing Benin, Senegal and Ghana over the same period confirms that human-resource management makes the difference. Ghana consolidates its gains. Senegal, by contrast, started from a favourable level (33.7 in 2010) but saw its ratio deteriorate to 36.3 in 2018 under the combined pressure of demographics and an insufficient recruitment pace: proof that a good starting point protects nothing if the effort slackens. Benin, for its part, is catching up from a high level. Three paths, three lessons: one can consolidate, one can catch up, but one can also regress, and it is the quality of planning, not wealth alone, that separates these fates.
Measuring the stakes: a demographic and financial wall
The scale of the effort ahead is dizzying. Simply to maintain and improve supervision in the face of rising pupil numbers, sub-Saharan Africa will need to recruit 15 million additional teachers by 2030 (UNESCO). The sharpest primary shortfalls affect a handful of countries, including Mali, Niger, the Central African Republic and Chad, which will have to push the annual growth of their teaching workforce above 6 %. For the record, in low-income countries the number of primary teachers will have to rise by nearly 50 % by 2030 to meet the targets (UNESCO). As a regional benchmark, Nigeria in 2025 deployed some 915,913 teachers for 31.77 million primary pupils, a ratio of 34.7 (Universal Basic Education Commission, UBEC).
Sub-Saharan Africa bears the largest education financing gap in the world: about 70 billion dollars per year, out of a global shortfall estimated at 97 billion (UNESCO, GEM Report).
This demographic wall runs into a financial wall. The region concentrates the largest education financing gap in the world, on the order of 70 billion dollars per year, out of a global shortfall estimated at 97 billion to meet SDG 4 (UNESCO). Several countries now devote to debt servicing amounts close to their education budgets, which mechanically compresses room for recruitment. In this context, the idea that one could simply decree the recruitment of hundreds of thousands of teachers runs into a hard budget constraint. It is precisely for this reason that the efficiency of every dollar spent, and therefore the quality of targeting, becomes strategic.
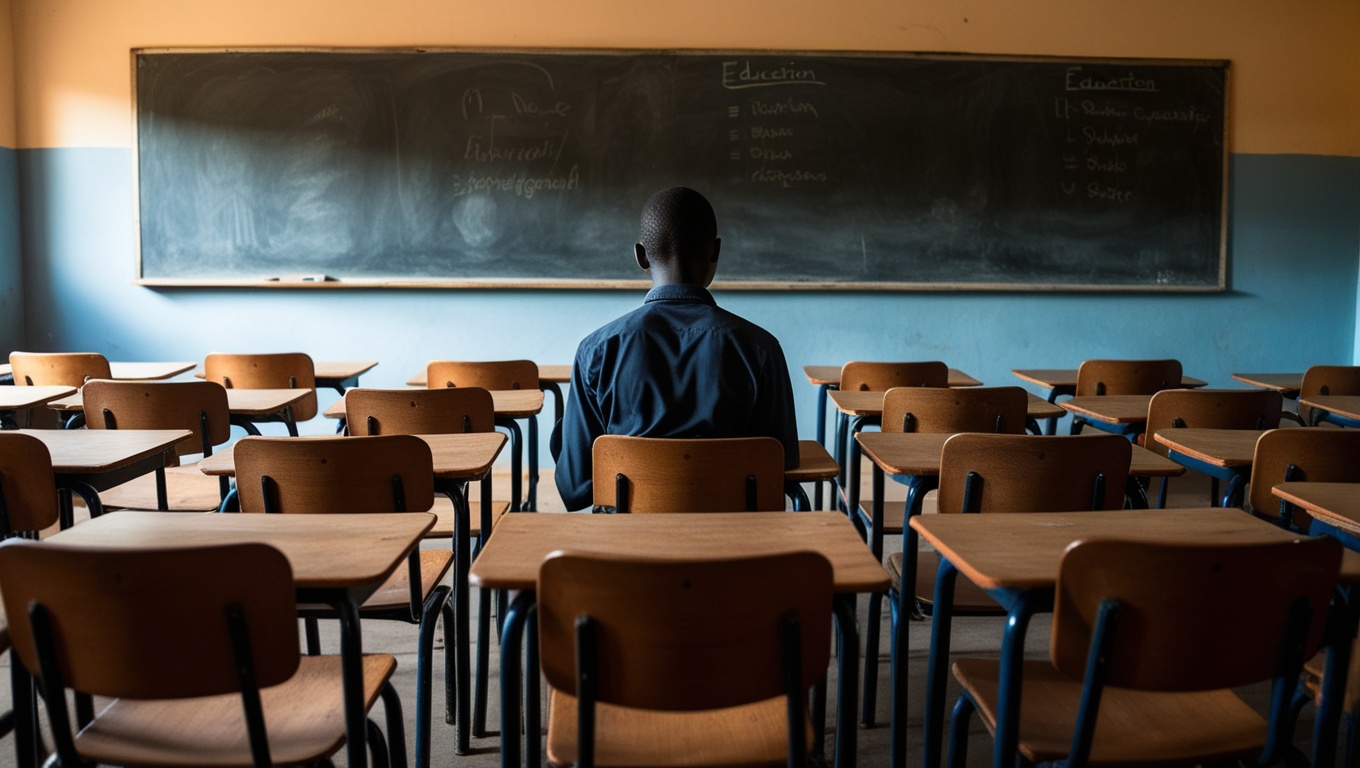
The cost of inaction
What happens if pressure on classes does not ease? The answer is already partly visible in learning outcomes. In sub-Saharan Africa, 89 % of 10-year-olds are in learning poverty, unable to read and understand a simple text, compared with about 87 % before the pandemic and a global rate of 70 % in low- and middle-income countries (World Bank, 2022). A high ratio is not the only cause of this deficit, but it is a powerful aggravating factor: less individual attention, less remediation, more children left behind from the earliest years, exactly where reading is acquired. The economic cost is colossal. The World Bank estimates at 21 trillion dollars the potential loss of lifetime earnings for the current generation of pupils, the equivalent of 17 % of today's global GDP. Inaction on school supervision is therefore not a saving: it is deferred debt, paid later in lost human capital and amputated growth.
What averages hide, and why CRAD measures it
A national average of 39 pupils per teacher can conceal radically different situations: a well-supervised urban class of 30 pupils and a rural class of 70 entrusted to an unqualified teacher. The national ratio smooths out these within-country gaps, which are nonetheless the ones that decide the fate of learning. Two blind spots in particular deserve decision-makers' attention. The first is qualification: massively recruiting untrained teachers would lower the ratio without improving learning. Yet in sub-Saharan Africa the share of primary teachers holding the minimum required qualifications fell from 84 % in 2000 to 65 % in 2019 (World Bank). Improving the numbers indicator while degrading the qualification one would be a statistical illusion. The second blind spot is gender and geography: women make up nearly half of primary teachers but only 30 % at secondary level (2018), and their scarcity is particularly acute in rural areas, where their presence is nonetheless decisive for the enrolment and retention of girls.
The gender dimension concretely illustrates why an aggregate figure misleads. The under-representation of female teachers at secondary level (only 30 %) and their scarcity in rural areas do not show up in a national headcount average, yet they weigh heavily on girls' schooling, especially in adolescence: the presence of nearby female teachers reduces female dropout and offers role models. A system that merely recruited to lower the ratio, without regard for the profile or assignment of recruits, could thus improve its indicator while leaving the most structural inequalities intact. The ratio is a useful thermometer; on its own it says nothing about the composition or the distribution of the teaching workforce.
This is where the value of fine-grained, disaggregated and geolocated measurement becomes decisive for public decision-making. Tracking a single national figure leads to undifferentiated blanket policies. Tracking the ratio by department, by municipality, by setting (rural/urban), cross-referenced with teacher qualification, gender and pupils' actual achievement, by contrast allows scarce resources to be allocated where the social return is highest. This is the approach CRAD applies in its monitoring and evaluation assignments: not merely counting teachers, but linking the ratio, qualification, territorial deployment and real impact on learning, to turn descriptive data into a steering tool. A map of overcrowded classes is worth more than a reassuring average.
Lowering the ratio by recruiting unqualified teachers improves the indicator without improving learning: quantity and quality must advance together.
This demand for granularity is not an expert's luxury. It conditions the effectiveness of every CFA franc invested in a context where budgetary room is tight. Better measurement means better targeting; and better targeting means more learning for the same recruitment effort. Conversely, steering blind amounts to diluting an already insufficient resource. The debate on the pupil-teacher ratio would gain by shifting from volume alone toward the volume-quality-distribution combination, the only one capable of producing durable learning gains.
Key takeaways
- Strong regional heterogeneity: from 27 pupils per teacher in Ghana to 41.8 in Côte d'Ivoire (World Bank, 2018). The gap is a matter of steering, not fate.
- Benin gained more than 7 points (46.4 in 2010 to 39.2 in 2018), but on an unstable trajectory still dependent on recruitment waves.
- Attrition undermines the effort: globally, the departure rate of primary teachers nearly doubled, from 4.62 % (2015) to 9.06 % (2022) (UNESCO, 2024).
- The cost of inaction is massive: 89 % of 10-year-olds in learning poverty in sub-Saharan Africa, and 21 trillion dollars of lifetime earnings lost for the current generation (World Bank, 2022).
- Quantity is not enough: the share of qualified primary teachers fell from 84 % (2000) to 65 % (2019) in sub-Saharan Africa. Measuring finely means targeting accurately.
Recommendations to West African decision-makers
- Plan recruitment on a multi-year horizon aligned with demographic projections, rather than through budgetary swings: target at least 6 % annual growth of the teaching workforce in the most deficient countries (Mali, Niger), to run at least as fast as the growth in pupil numbers.
- Treat attrition as a priority on a par with recruitment: track and reduce early-career departures (pay, working conditions, support), because a high outflow rate cancels the hiring effect on the ratio.
- Condition any expansion of numbers on qualification: raise the share of teachers meeting national standards, beyond the 65 % observed in sub-Saharan Africa, through large-scale initial and in-service training programmes.
- Target territorial deployment to reduce within-country gaps, prioritising the assignment of qualified teachers (and more women) to rural and disadvantaged areas where classroom pressure is greatest.
- Set up monitoring and evaluation systems linking the ratio, qualification, gender and pupils' achievement, disaggregated by municipality and setting, so as to steer quality and not only numbers and to optimise every expenditure in a context of financing shortfall (70 billion dollars per year for the region).
- Capitalise on the region's winning trajectories (Ghana's consolidation model) by documenting and transferring teacher human-resource management practices.
Sources
- World Bank, Pupil-teacher ratio, primary indicator (SE.PRM.ENRL.TC.ZS)
- World Bank, Trained teachers in primary education (% of total teachers) (SE.PRM.TCAQ.ZS)
- World Bank, 70% of 10-Year-Olds now in Learning Poverty (2022)
- UNESCO, The persistent teacher gap in sub-Saharan Africa
- Teacher Task Force, The persistent teacher gap in sub-Saharan Africa
- UNESCO, Global Report on Teachers 2024 (attrition, feminisation)
- UN News, Sub-Saharan Africa faces a 70 billion USD annual education financing gap (UNESCO GEM)
- PUNCH Nigeria, 915,000 Teachers Struggle to Serve 31.7M Nigerian Pupils
- Global Partnership for Education, West and Central Africa Challenge in Access to Quality Education
- The Conversation, Rapid population growth in West Africa