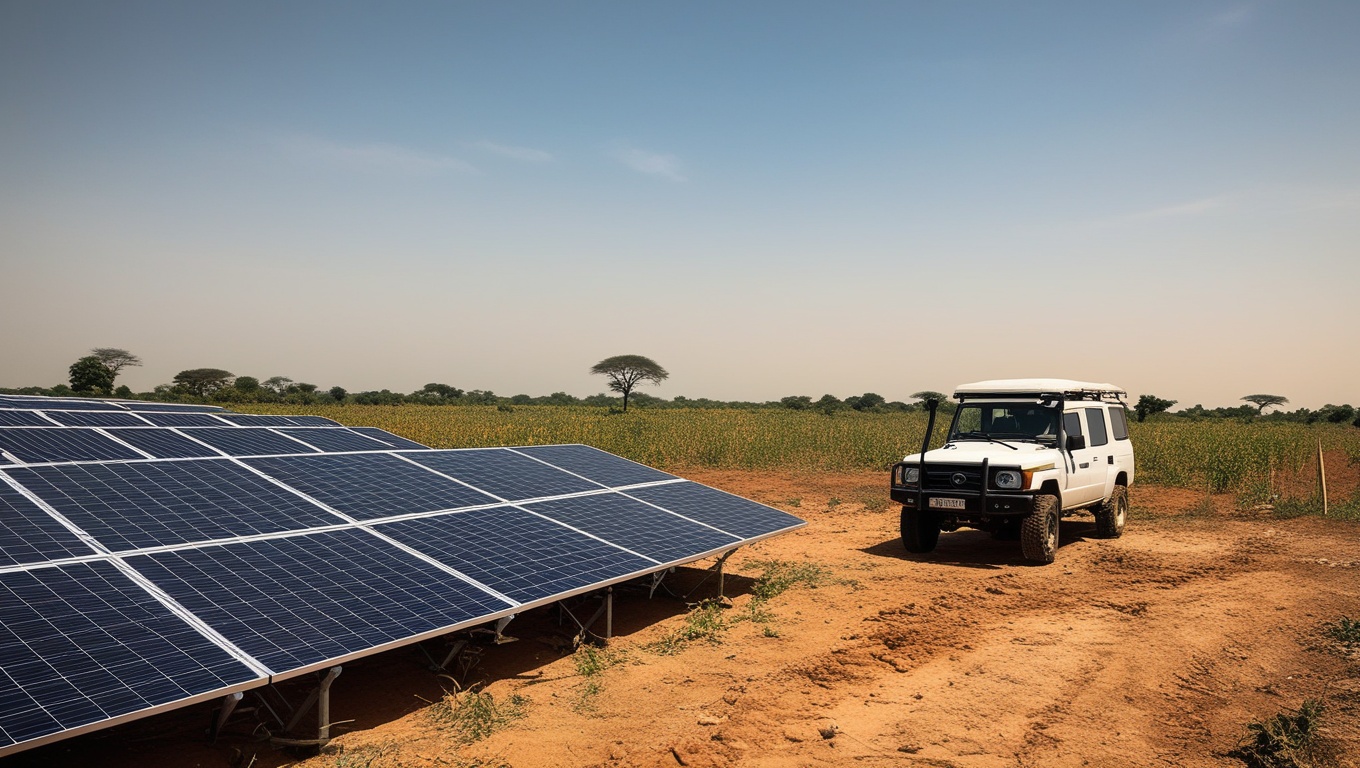
Solar capacity: dazzling potential, timid deployment
West Africa holds one of the most abundant solar resources in the world, yet it barely exploits it. By the end of 2025, nine benchmark countries (Benin, Ghana, Senegal, Nigeria, Niger, Côte d'Ivoire, Mali, Burkina Faso, Togo) had installed a combined total of only 1,346 MW of photovoltaic capacity according to IRENA statistics, the equivalent of a single large power plant in an industrialised country, for a region of several hundred million inhabitants. The contrast is striking: every kilowatt-peak planted in Sahelian soil can produce nearly 5 kWh per day, a world-class yield, while 181 million people remain unconnected in West Africa and diesel generators keep running. The problem is therefore not the sun. It lies in the ability to turn a theoretical resource into projects that are financeable, delivered and measured.
A world-class resource, a minuscule capacity
Let us start with the order of magnitude, because it is stubborn. The region's practical solar potential, measured by the yield a panel can actually deliver once installed (the Global Solar Atlas PVOUT), ranges between 3.9 and 5.0 kWh per kilowatt-peak per day. This is a level most European countries will never reach. Niger peaks at 5.0 kWh/kWp/day, Mali at 4.86, Senegal at 4.64, Burkina Faso at 4.63. Even the more humid coastal countries, less favoured, remain above 3.9. The World Bank points out that a Sahelian country could cover its entire electricity consumption by solarising a tiny fraction of its territory.
Against this resource, installed capacity cuts a poor figure. Senegal, the largest fleet in the zone, does not exceed 289.9 MW; Nigeria, the demographic giant with more than two hundred million inhabitants, tops out at 284.5 MW, almost on a par with a country eight times less populous. Benin, at 35.3 MW, brings up the rear. Relative to the available resource, the region exploits a derisory share of what it could produce. To grasp the scale of the gap, one need only convert the resource into equivalent terms: the technical solar potential of West Africa alone is counted in tens, even hundreds, of gigawatts, when installed capacity struggles to cross 1.3 gigawatts. The gap between dazzling potential and timid deployment is not a nuance; it is the central fact of the West African energy transition.
Real growth, but starting from almost nothing
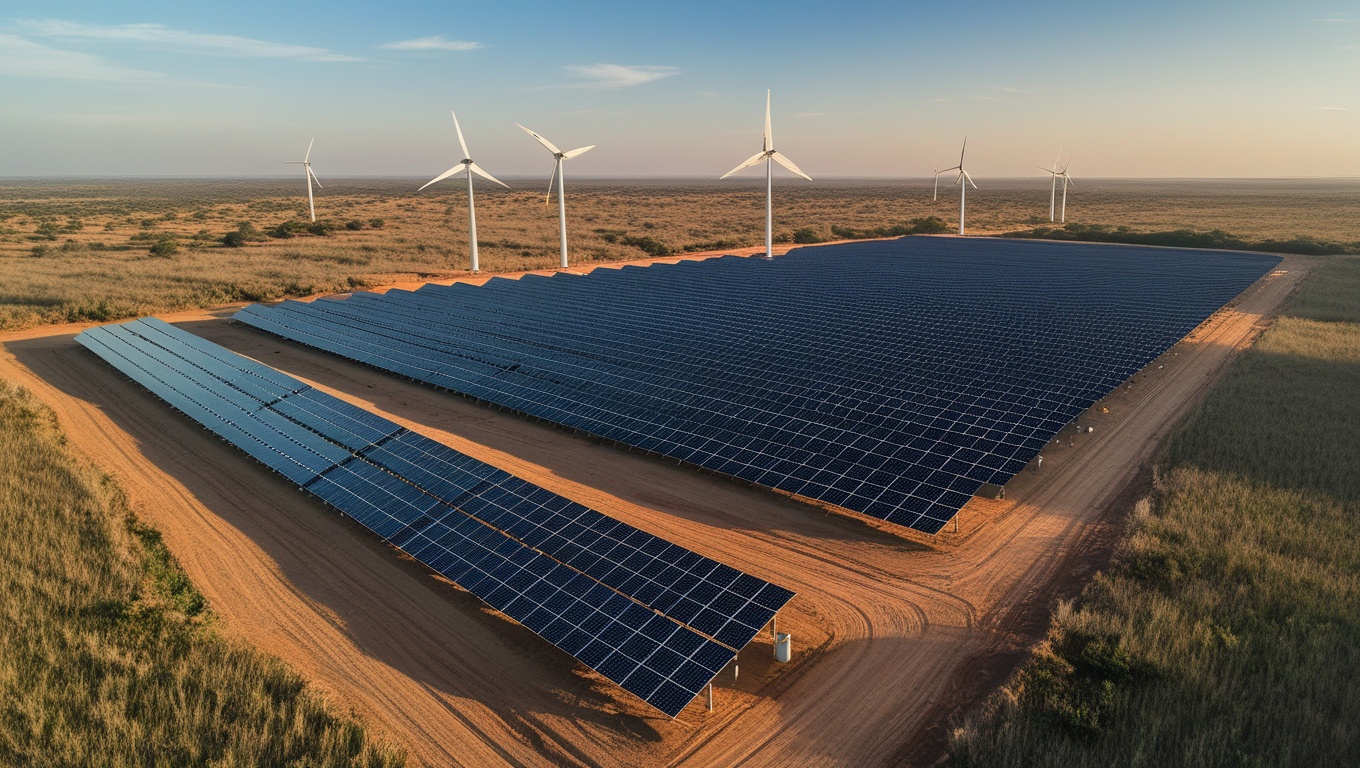
It would be unfair to deny the momentum. In fifteen years, the cumulative solar capacity of the nine countries has multiplied by 92, rising from 14.6 MW in 2010 to 1,346 MW in 2025. Over the last five years alone, it has jumped by 169%, from 499.7 MW in 2020 to 1,346 MW today. The curve turned up sharply from 2016 onwards, when the first competitive tenders and large power plants began to replace pilot installations. This acceleration is entirely real and it proves that the mechanism works when it is set in motion.
But a spectacular multiplication from a minuscule base remains a small absolute value. Multiplying a starting point of 14.6 MW by 92 yields only a little more than 1,300 MW, to be compared with a resource counted in tens of gigawatts. The rapid growth masks an accumulated lag: the region starts from so low that even a fine slope leaves the installed level far below the needs. The pace itself can be seen in the intervals: it took six years to go from 14.6 to 130 MW (2010-2016), but only three years to add the last 470 megawatts (2022-2025). The acceleration is real, and that is precisely what makes the lag so frustrating: the region now knows how to build fast, but it started late. The good news is that the trajectory is upward; the bad news is that, at the current pace, catching up with the resource will take decades.
The resource is not the brake: the proof by potential
The most convenient argument for justifying the lag would be to invoke differences in the resource. The data refute it. Practical solar potential varies very little within the region: by a factor of less than 1.3 between Côte d'Ivoire (3.9 kWh/kWp/day), the least well endowed, and Niger (5.0), the best endowed. In other words, the worst-served country in the zone already enjoys a resource that many wealthy economies would envy. Nigeria shows 4.13 kWh/kWp/day at a representative point, a national average potential of 4.32 according to the World Bank, for an installed capacity that is derisory relative to its population.
The least sun-endowed country in the zone already enjoys a resource that many wealthy economies would envy. If deployment remains timid, it is not the resource that is lacking.
The reasoning thus turns against fatalism: since the resource is almost uniform and excellent everywhere, the gaps in installed capacity cannot be explained by nature. They are explained by what is decided, that is, by public policy, the investment framework and the ability to structure projects. Where the potential is a given, deployment is a choice. The comparison is instructive: the ratio of installed capacity between the first and last country in the zone exceeds 8 to 1, when the ratio of resource does not exceed 1.3 to 1. In other words, the gap in results is more than six times greater than the gap in natural endowment. Such a divergence cannot be blamed on the sky: it is played out entirely in the human decisions that separate a resource from a productive asset.
What the absolute ranking hides: solar per capita
As soon as capacity is related to population, the hierarchy flips and reveals true performance. Senegal reaches 15.7 watts installed per inhabitant, by far the first in the zone. Togo follows at 10.3 W, Burkina Faso at 8.7 W. At the other end, Nigeria and Côte d'Ivoire top out at 1.2 W per inhabitant, a genuine regional floor. The gap between first and last reaches a ratio of 1 to 13 per head, out of all proportion to the resource gap (less than 1.3).
This reading demolishes two illusions. The first is that Nigeria would be a solar leader: its second place in absolute value is merely an effect of demographic mass, and per inhabitant it ranks last. The second is that small countries would be doomed to stay small: Senegal shows that a medium-sized State, by pursuing a determined policy, can display a solar density ten times greater than that of the regional giant. Capacity per inhabitant is the only indicator that truly measures a country's equipment effort, because it neutralises both the size of the territory and the weight of the population, and reduces each fleet to what it really represents for the citizen waiting to be connected.
Why Senegal took off and Benin stalled
Comparing trajectories is the best antidote to discouragement, because it shows the investment framework at work. Senegal went from 7.4 MW in 2015 to 289.9 MW in 2025, a multiplication by nearly forty in ten years. This take-off is no meteorological accident: it coincides with the pairing of competitive tenders, notably the Scaling Solar programme, with power plants of several tens of megawatts that attracted private investors at tariffs among the lowest on the continent. Burkina Faso and Mali, Sahelian and very well endowed with irradiation, accelerated on their own through public power plants and mini-grids.
Benin illustrates the opposite scenario, then the possible catch-up. Long dependent on electricity imports from its neighbours, it stayed below 5 MW until 2020 (1.4 MW in 2015, 4.8 MW in 2020). Take-off comes only after 2020, with the Défissol power plants and the programme funded by the Millennium Challenge Corporation, which pushed capacity up to 33.4 MW in 2022 then 35.3 MW. Since then, the curve has flattened out: the country climbed one step, but did not trigger the continuous momentum that carried Senegal. The contrast between the two curves does not tell of two climates, it tells of two intensities of public effort.
The Senegalese lesson is not a model to be traced over, but a reproducible principle: solar takes off when the State turns an intention into a structured pipeline, with regular tenders, prepared sites and multi-year visibility for the investor. Conversely, a stop-and-go policy, a flagship project followed by a long silence, produces exactly the Benin curve, in steps. It is not occasional fervour that builds a fleet, it is the regularity of public procurement and the constancy of the framework. Senegal understood that the primary driver of falling tariffs is not the subsidy, but the predictability offered to developers.
Two models of renewable fleet, two places for solar
The regional average masks another divide, this one structural: the place of solar in the renewable mix differs radically from one country to another. Two models coexist. On one side, fleets that are almost exclusively solar, for lack of hydroelectricity: in Benin, solar accounts for 99% of installed renewables (35.3 MW out of 35.8 MW); in Niger, the entirety; in Burkina Faso, 85%. In these countries, devoid of large developable rivers, solar is not one option among others, it is the renewable transition itself.
On the other side, fleets dominated by hydroelectricity, where solar remains marginal despite a high total renewable capacity. Nigeria shows 3,206 MW of installed renewables, Ghana 1,778 MW, Côte d'Ivoire 1,029 MW, but the bulk comes from dams, with solar representing only a fraction. This is a frequent analytical trap: some sources wrongly attribute to solar figures that include hydro. Côte d'Ivoire, with 1,029 MW of total renewables but only 39 MW of solar, is the perfect illustration. Confusing the two amounts to massively overestimating the solar effort of hydro-dependent countries.
This divide has a direct consequence for climate vulnerability, often forgotten in debates on the mix. Hydro-dependent countries are not safe: their production depends on rainfall patterns and reservoir levels, precisely what climate disruption makes more erratic. A drought year can severely cut their hydro electricity, as the repeated low-water crises on several West African dams have shown. Solar, whose resource is stable and predictable from one year to the next, then plays the role of a hedge against hydrological risk. In other words, even for countries richly endowed with dams, accelerating solar is not a luxury of diversification, it is an insurance against the growing variability of their hydraulic base.
What the lag costs: 181 million people without electricity
Behind the megawatts lie lives. In 2024, about 181 million people lived without access to electricity in West Africa, according to the International Energy Agency, and nearly 600 million across sub-Saharan Africa, or 47% of its population. This deficit is not residual: sub-Saharan Africa alone concentrates 86% of the global electricity access deficit. Minuscule solar and a massive access deficit are two sides of the same coin: where capacity is lacking, there are health centres without a cold chain, schools without lighting, workshops deprived of electric tools and households forced back onto kerosene and batteries.
The most alarming point is that demography erases progress. In 2024, sub-Saharan Africa connected 6.8 million more people than in 2023, but population growth in unserved areas absorbed most of that effort, so much so that the total number of people without electricity fell by only 4 million. In other words, the region is running to stand still. Each year of timid solar deployment is not merely a missed equipment opportunity: it is ground lost against a population growing faster than the grid can extend. The connection pace itself has slowed, falling from 23 million people gaining access each year in 2019 to fewer than 19 million in 2023-2024, even as needs explode.
In 2024, 181 million West Africans live without electricity, and population growth erases almost all the progress of connection. The region is running to stand still.
The cost of inaction: what each year of delay costs
The deployment lag is not neutral: it has a price, paid every year. As long as solar capacity remains minuscule, the missing electricity is filled by diesel, electricity imports and waiting. Each year of delay translates into generators burning imported fuel, into electricity import bills for deficit countries, and above all into delayed access for tens of millions of unconnected people. The untapped resource is not a quiet reserve: it is a cost that keeps running.
The paradox is all the crueller because solar is today one of the cheapest sources of electricity to produce, and because the resource, free and abundant, is already there. Not exploiting it amounts to preferring a costly, imported fuel over cheap, local energy, year after year. The calculation reverses completely when one looks at duration: diesel is paid per litre, every day, as long as the generator runs, whereas the solar panel concentrates its cost at installation then produces a zero-fuel output for twenty-five years. To defer solar investment is therefore to knowingly choose recurring expenditure over one-off expenditure, outgoing currency over a local asset. The real cost is not that of installing panels, but that of continuing without them.
The financing knot: 15 billion dollars expected, less than 2.5 committed
If the resource is there and solar is competitive, the true stranglehold reads in the financing figures. The International Energy Agency estimates that nearly 150 billion dollars, about 15 billion per year, would need to be invested to achieve universal access to electricity in Africa over the coming decade. Yet in 2023, less than 2.5 billion dollars were actually committed for new connections in sub-Saharan Africa. The gap is vertiginous: the real flow represents barely one sixth of what would be needed. It is not the solar resource that is lacking, nor the technology, it is the capital that refuses to commit at the scale of the need.
The composition of this need illuminates the blind spot. According to the IEA, a little less than half of the annual investment would target grid extension, about a third mini-grids and a little over 20% solar home systems. In other words, a majority share of access financing rests on decentralised solar, precisely the segment that is hardest to structure and most poorly documented. And because capital remains scarce and expensive, every point of perceived risk is paid for in interest rates: a West African solar project borrows on far harsher terms than an equivalent project in Europe, not because the sun there is less reliable, but because the data that would reassure the lender is missing. The cost of capital is, ultimately, the real price of uncertainty.
The real lock: bankable data
If the resource is excellent and solar competitive, why do projects lag? Because between theoretical potential and the investment decision stands an often invisible obstacle: the lack of bankable data. A funder or a private investor does not commit capital to a country without reliable series of installed capacity, without measurements of the real output of sites, without an inventory of existing assets, without qualified land. In the absence of such data, perceived risk rises, tenders drag on, and the resource stays on paper.
This is where the gap between dazzling potential and timid deployment is decided. The brake is not geophysical, it is informational and institutional. Structuring a financeable solar project requires knowing precisely how much a given site will produce, the state of the grid, where the unmet needs are, how demand is evolving. These field diagnostics, these asset inventories and these monitoring systems are cruelly lacking in most countries of the zone. Yet this is exactly the link that turns a sunshine map into a portfolio of projects.
The gap between dazzling potential and timid deployment is first and foremost a problem of bankable data: without reliable series, funders hesitate and tenders stay slow.
This is the conviction that guides CRAD's work on the energy transition. We produce the field diagnostics, the asset inventories and the monitoring and evaluation systems that turn a theoretical resource into financeable projects: geolocated digital data collection, site qualification, measurement of real output, monitoring dashboards. It is the bridge between African solar data and the investment decision, the very one that is most lacking today. CRAD has already carried this expertise into the sustainable energy sector with the regional WOCEWA project on gender equality in ECOWAS energy SMEs.
Gender and financing: two levers to loosen the lock
Solar deployment does not come down to large power plants: it also runs through mini-grids, home systems and the energy SMEs that drive decentralised electrification. This segment is not marginal, since the IEA earmarks more than half of the required access financing for it. Yet these players are often poorly financed and little documented, which makes them invisible to funders. The gender dimension is decisive here: women are under-represented in the leadership of energy SMEs, while they constitute a pool of entrepreneurship and proximity to end users. Without data disaggregated by sex and by company size, it is impossible to target financing instruments where they would unlock the most capacity.
The issue goes beyond equity: it is one of efficiency. The last mile of electrification, that of isolated villages and peripheral neighbourhoods, is not won by large power plants plugged into the national grid, but by a dense fabric of small operators in contact with users. It is they who install the systems, maintain the mini-grids, collect payments and adapt the offer to modest budgets. Yet this fabric remains largely off the radar of national statistical systems, which count the megawatts of large fleets but ignore the myriad decentralised installations. Making these players visible, measuring their number, their capacity, their diversity and their financial health, is the condition for access financing to finally reach its target, rather than concentrating on the projects that are already bankable.
- Land and the grid. A solar site is financeable only if its land is secured and its grid connection qualified: the slowness of projects often stems from these undocumented prerequisites.
- Output measurement. Investors value the kWh actually produced, not the theoretical potential: on-the-ground measurement campaigns reduce perceived risk and therefore the cost of capital.
- SMEs and gender. Decentralised electrification rests on a fabric of SMEs, many of which could be led or staffed by women, provided data is available to steer credit and support.
- Competitive tenders. The Senegalese model shows that transparent competition drives tariffs down, provided it rests on reliable site and demand data.
From resource to portfolio of projects
Fundamentally, the story of West African solar is not that of an insufficient resource, but of an unfinished value chain. The resource is there, exceptional and almost uniform. The technology is mature and cheap. Growth momentum is under way. What is missing is the central link connecting potential to investment: the data that qualifies sites, measures output, inventories assets and tracks results. The countries moving forward, Senegal first among them, are those that have managed to structure this chain; those that stagnate do not lack sun, they lack projects ready to finance.
Closing the gap is therefore less a matter of panels than a matter of method: measure before investing, qualify before tendering, monitor after installing. Turning a dazzling resource into electricity for all is a matter of public-policy choice and data discipline, not a climatic fatality. The sun, for its part, is not lacking.
Key takeaways
- Nine benchmark countries had installed a combined total of just 1,346 MW of solar by the end of 2025, a minuscule capacity against a world-class resource and 181 million West Africans without electricity.
- The resource is not the brake: solar potential varies by a factor of less than 1.3 across the entire zone (3.9 to 5.0 kWh/kWp/day), while the installed-capacity gap exceeds 8 to 1.
- The absolute ranking is misleading: Senegal reaches 15.7 W per inhabitant while Nigeria tops out at 1.2 W, its second place being merely an effect of demographic mass.
- Financing is the crux: about 15 billion dollars per year would be needed for universal access in Africa, but less than 2.5 billion were committed in 2023.
- The real lock is bankable data: without reliable series of capacity, output and qualified sites, funders hesitate and tenders drag on.
Recommendations for West African decision-makers
- Set a national target for solar capacity per inhabitant, aligned with Senegal's performance (15.7 W/inhab), and track it through an enforceable annual public indicator.
- Generalise competitive and transparent tenders on the Scaling Solar model, which drove tariffs down and attracted private investment in Senegal.
- Invest in site qualification and real-output measurement (on-the-ground measurement campaigns, secured land, grid status) to reduce perceived risk and the cost of capital.
- Build reliable, public data series on installed capacity, output and existing assets, an indispensable condition for making projects bankable and closing the financing gap.
- Target the financing of decentralised electrification (mini-grids, energy SMEs), which absorbs more than half of the access investment need, based on data disaggregated by company size and by sex.
- For countries without large hydroelectricity (Benin, Niger, Burkina Faso), treat solar not as a diversification but as the core of the renewable strategy, and allocate resources accordingly.
Sources
- IRENA, Electricity Capacity Statistics (pxweb database, 2026 cycle, data through 2025)
- IRENA, Renewable Capacity Statistics 2026 (report)
- IRENA, Renewable Capacity Highlights, 31 March 2026
- IRENA, Statistics and Data page
- Global Solar Atlas (Solargis / World Bank Group)
- World Bank / ESMAP, Global Photovoltaic Power Potential by Country (2020)
- World Bank, Solar Photovoltaic Power Potential by Country (page)
- World Bank, Data API (total population, SP.POP.TOTL)
- IEA, Financing Electricity Access in Africa (2024), Executive summary
- IEA, SDG7 Data and Projections, Access to electricity (population without access 2024)
- Our World in Data, Installed solar PV capacity (source Ember & IRENA)
- IRENA, Renewable Energy Statistics 2025