Connected field: how digital data transforms agricultural value chains
In a West African agricultural value chain, information almost always arrives too late to be useful. A paper survey requires data entry, checking, cleaning and then consolidation: as many stages where data is lost, ages or becomes distorted. By the time the report lands, the season is over, the funder has already decided, and the farmer remains an anonymous dot in a national average. Mobile digital data collection reverses this logic. Data is captured, geolocated and validated in the field, then flows in near real time to a dashboard. This shift is no minor tooling detail. In economies where agriculture employs the overwhelming majority of workers and accounts for up to a third of GDP, the quality and freshness of agricultural data directly determine the quality of public policy and financing decisions. And this is precisely where West Africa lags most expensively: not in the fields, but in measuring what happens there.
An under-measured agricultural economy
The first fact to establish is the sector's real weight. In West Africa, agriculture is not one activity among others: it is the foundation of employment and income. According to modelled estimates from the International Labour Organization compiled by the World Bank, it still employed nearly 73 percent of workers in Niger in 2024, 64 percent in Mali, 52 percent in Burkina Faso and 41 percent in Benin. In value-added terms, it represented between 16 percent of GDP in Côte d'Ivoire and more than 32 percent in Niger and Mali in 2023. Such concentration should call for impeccable agricultural statistics. The opposite prevails: most low-income countries still cannot produce the three core agricultural indicators expected to monitor the Sustainable Development Goal of Zero Hunger, for lack of a robust survey system. The paradox is striking: the most decisive sector for these economies is also one of the most poorly measured.
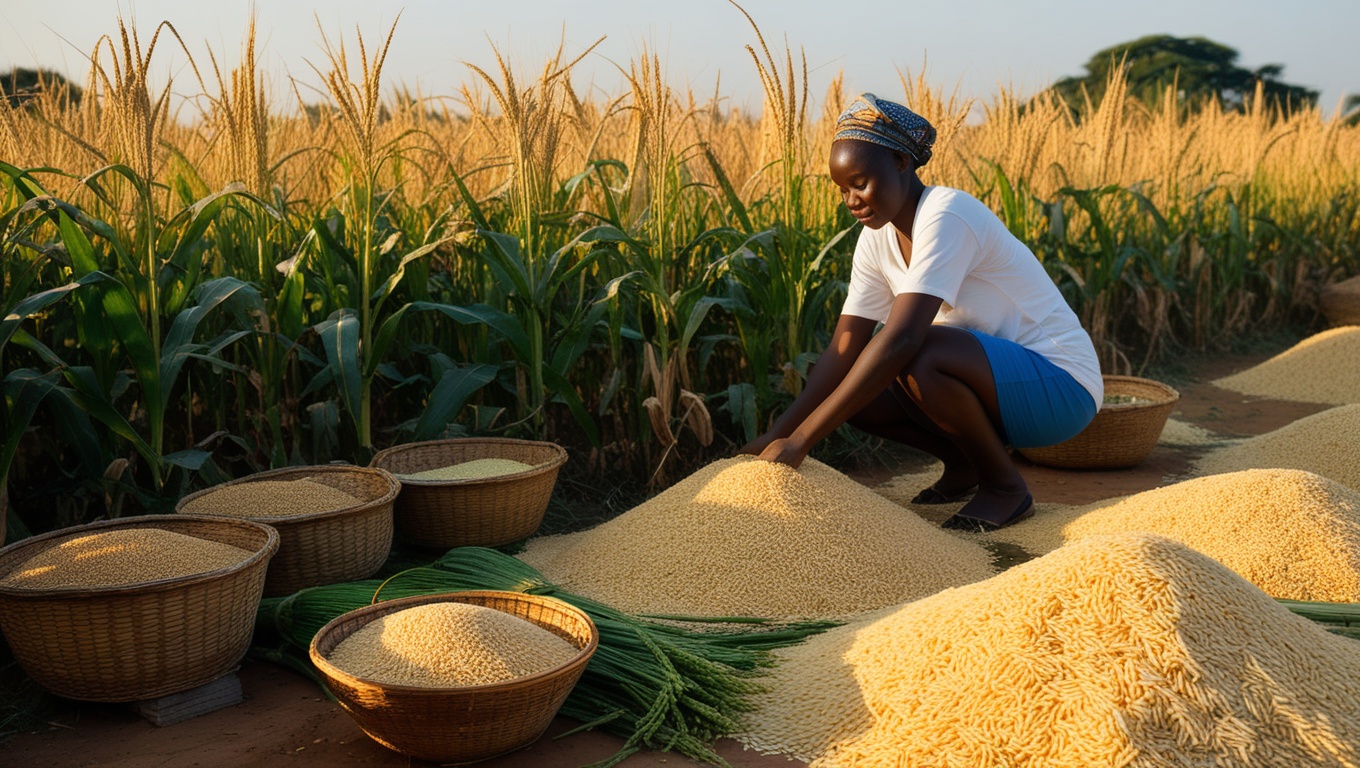
The sector's weight is not read in employment alone. In value-added terms, agriculture still represented a quarter of Benin's GDP in 2023 (25.4 percent) and nearly a third in Niger (32.5 percent) and Mali (32.2 percent), against 16 percent in Côte d'Ivoire and 21 percent in Ghana. Yet the gap between the share of employment (often above 40 percent) and the share of GDP (rarely above 30 percent) tells a story of productivity in itself: many hands for comparatively low value added, the mark of a sector that could produce and pay more. This productivity gap cannot be closed without knowing where it lies, farm by farm and value chain by value chain, which leads invariably back to the question of data.
The cost of paper: what is lost between field and decision
Paper collection is not only slow: it degrades data at every link. The questionnaire filled in the field must be carried back, re-keyed by an operator, checked, corrected and cleaned before any analysis. Each of these handlings introduces errors and delay. Comparative studies in African settings quantify this precisely. In a randomized public-health survey in Ethiopia, 41.9 percent of paper questionnaires contained at least one data-quality error, against 30.9 percent for electronic capture, with the overall error rate falling from 1.67 percent on paper to 0.60 percent on tablet. A South African study of an open-source digital capture system goes further: the error rate drops from 0.73 to 0.17 errors per 100 questions, about 77 percent fewer, and the share of interviews marred by at least one error falls from 33 percent to 8 percent. Above all, the paper errors included major faults requiring data deletion or re-surveying, whereas the digital errors remained minor.
The benefit does not stop at quality. The same South African study finds that, salary included, the cost per correctly captured question was half as much in digital as on paper, and that the higher upfront cost of equipment was recouped within six months. In other words, digital collection is not a technological luxury reserved for large budgets: beyond a modest volume threshold, it costs less than paper while delivering data that is more reliable and faster. For a funder financing a value-chain survey, or a state wanting to monitor a season, the trade-off is settled.
Delay, the hidden variable of steering
What digital collection changes most profoundly is the relationship to time. With paper, the chain between the last interview and a usable dataset is measured in weeks, often months: transporting the bundles, double data entry, cleaning. With mobile collection, data validated in the field is synchronized the same evening, and the dashboard updates while collection continues. This delay, long treated as a logistical fatality, is in fact the most strategic variable of steering. As long as it is measured in months, the survey only serves to draw an after-the-fact picture. Reduced to a few days, it becomes a steering instrument: an anomaly is detected during collection, an enumerator whose data is drifting is called back, a protocol is reoriented before it is too late. Data ceases to be an archive and becomes a signal.
As long as agricultural data is measured in months, it only serves to record. Brought down to a few days, it becomes an instrument to decide, correct and reorient while the season is still playing out.
The material precondition: rural connectivity
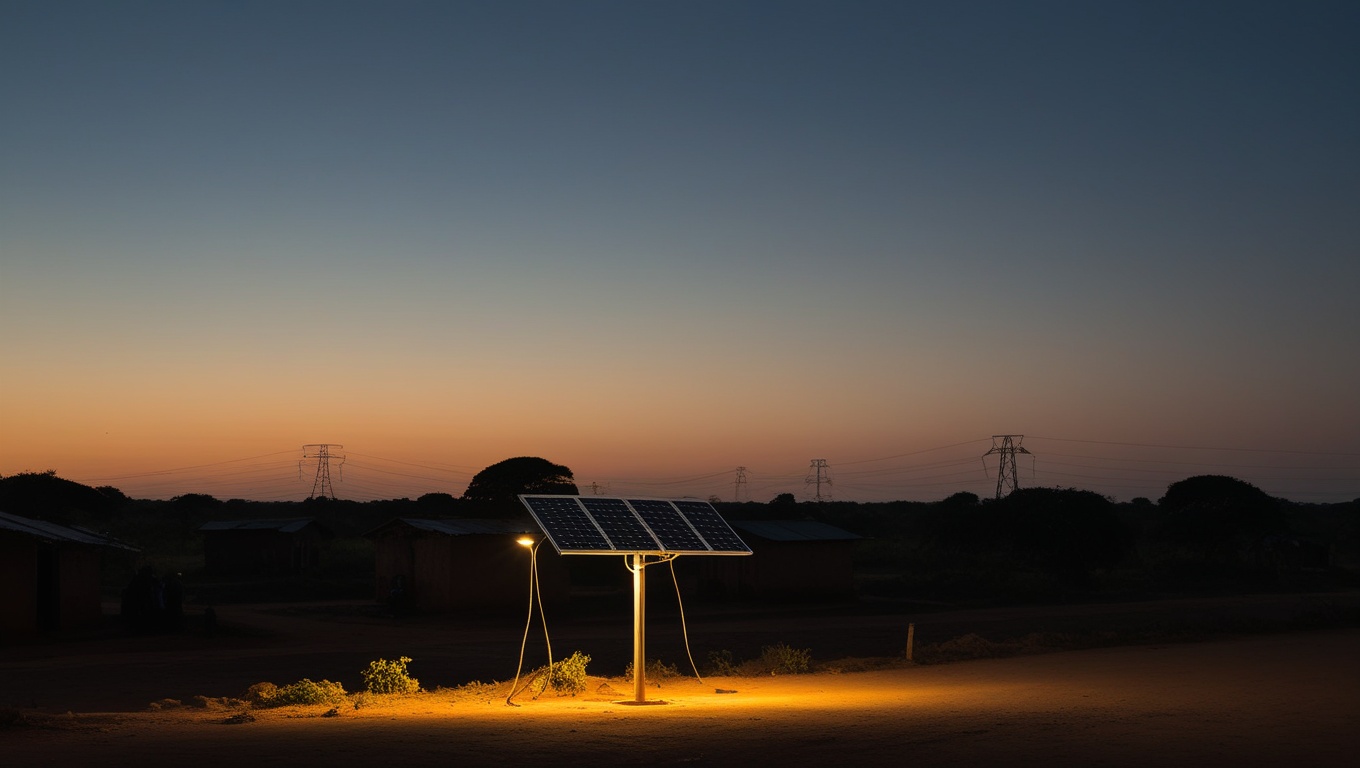
The connected field requires a network, and this is where the main caveat lies. Mobile coverage has progressed a great deal: networks now reach about 95 percent of the African population. But coverage is not usage. In sub-Saharan Africa, only about one person in four uses mobile internet, leaving a usage gap of around 60 percent of the population: people covered by a network but who do not connect to it, for lack of an affordable device, digital skills or electricity. And this gap is wider in rural areas, precisely where the farms are: rural adults are nearly half as likely to use mobile internet as city dwellers. For an agricultural survey, this divide imposes a concrete requirement: collection tools must work offline and synchronize only on return to a covered area. This is exactly what the sector's leading solutions allow.
The tools: a global standard now within reach
The shift was made possible by the maturity of an ecosystem of proven tools, most of them open source or free. Open Data Kit (ODK) laid the foundations; KoboToolbox, built on the same technical base, has become a reference in humanitarian and development work; CommCare targets the monitoring of frontline workers and beneficiaries; Survey Solutions, developed by the World Bank, structures large national statistical surveys. All share the same principles: a form designed in advance with its data-entry checks, a mobile application that works offline, automatic geolocation of observations and encrypted synchronization to a central server. This technical foundation is no longer experimental: it underpins national surveys, project evaluations and the monitoring systems of major funders. The barrier is therefore no longer the tool, now accessible and documented, but the method and the skills to deploy it properly.
- Consistency checks at source. The form blocks aberrant values at the moment of entry: an impossible yield, an inconsistent date or a missed mandatory field never get past the field stage.
- Systematic geolocation. Each surveyed farm is tied to its coordinates, making it possible to cross-reference production, rainfall, market access and agro-ecological zoning, cross-references impossible on a national average.
- Full traceability. Who collected what, where and when: this audit trail, native to digital, is the condition of the accountability funders demand and of quality control during collection.
- Offline operation. Data entry does not depend on the network at the time of the survey; synchronization happens on return to a covered area, which makes the tool usable even in the least connected zones.
From the farmer to the value-chain decision
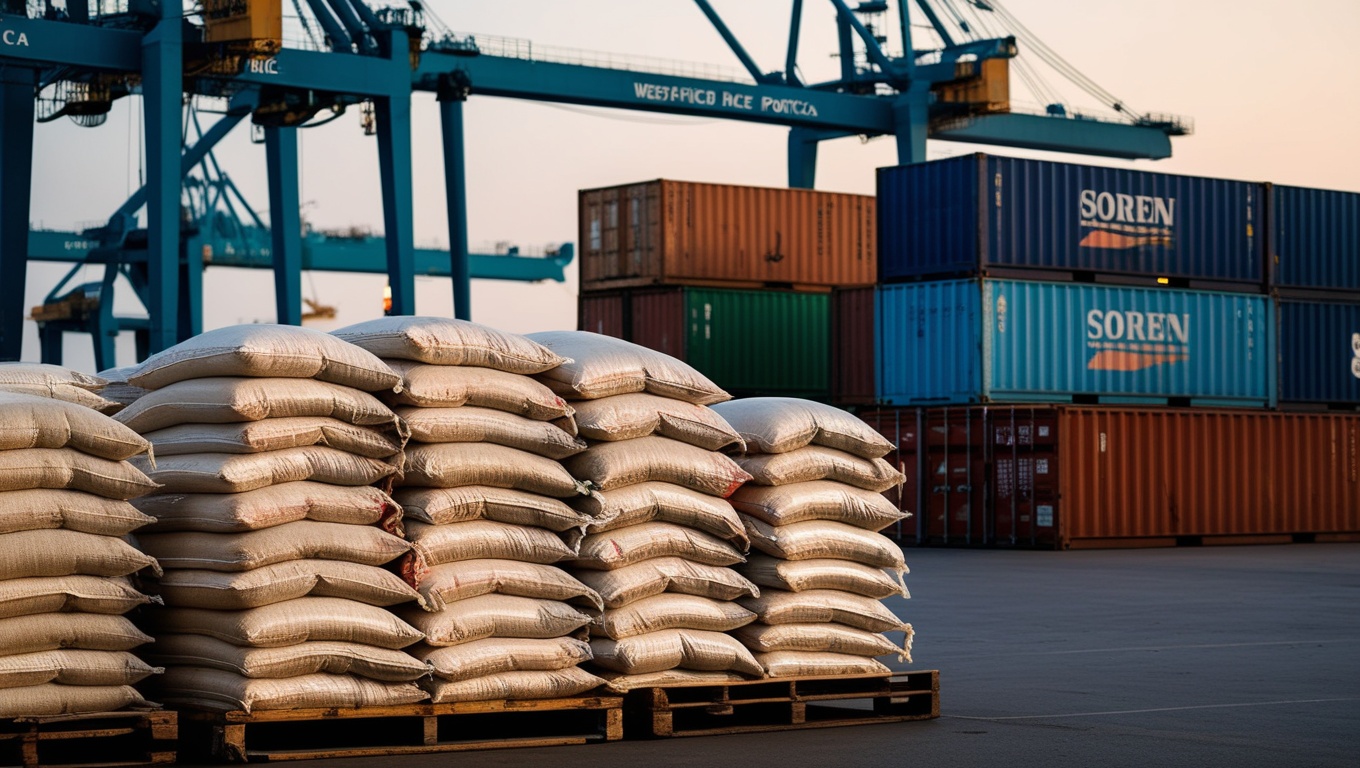
Well structured, field data does not stay at the stage of a results table: it feeds a continuous reading of the value chain, from the farmer to the strategic decision. Geolocated and disaggregated, it links a plot's yield to its access to inputs, its climate vulnerability and its distance to market. It is this continuum, from the survey of the farmer to the decision-maker's dashboard, that gives West African export chains their full value. The region has thus become a major player in cashew: Côte d'Ivoire, the world's leading producer of raw nuts, is targeting around 1.15 million tonnes in 2025, and Benin, which has banned the export of raw nuts since April 2024 to develop its local processing, projects on the order of 225,000 tonnes. On such chains, where every point of quality, traceability and local processing translates into foreign currency, geolocated data renewed season after season is not an analytical comfort: it is the instrument that allows decisions on where to invest, which cooperative to support and which link of the value chain to strengthen.
The framing: digital data as a public good
This stake must be placed at the right level. The agricultural statistics deficit is not a technical matter reserved for statisticians: it is a hole in public decision-making. Globally, low- and middle-income countries invest hundreds of billions of dollars each year in agriculture, often without reliable data to guide that spending. This observation gave rise to the international 50x2030 initiative, a ten-year partnership led by the World Bank, the FAO and IFAD, endowed with around 500 million dollars, to equip fifty low- and middle-income countries with modern agricultural survey systems, relying largely on digital collection. At the heart of this design lie the same mobile tools and the same ambition: to produce quality agricultural data, on time, and make it accessible so that decisions stop advancing blind. Digital collection is therefore not a project gadget: it has become the basic infrastructure of a public good, reliable knowledge of the most vital sector of these economies.
The cost of inaction: deciding on stale data
The cost of paper collection is not read only in data-entry errors: it is paid in poorly calibrated decisions. When a season survey is only usable months after the harvest, the policy it was meant to inform has already been set on rough estimates. A poorly targeted input subsidy, a storage programme sized on erroneous volumes, a food-security alert issued too late: each of these failures has a real cost, in wasted public money as in lost harvests or income. In economies where agriculture employs most of the active population, imprecise data is not a matter of statistical comfort, it is a direct driver of poor allocation of scarce resources. The real cost is not that of modernizing collection, which pays for itself within months, but that of continuing to steer a major agricultural economy with measuring instruments from another age.
What national averages hide
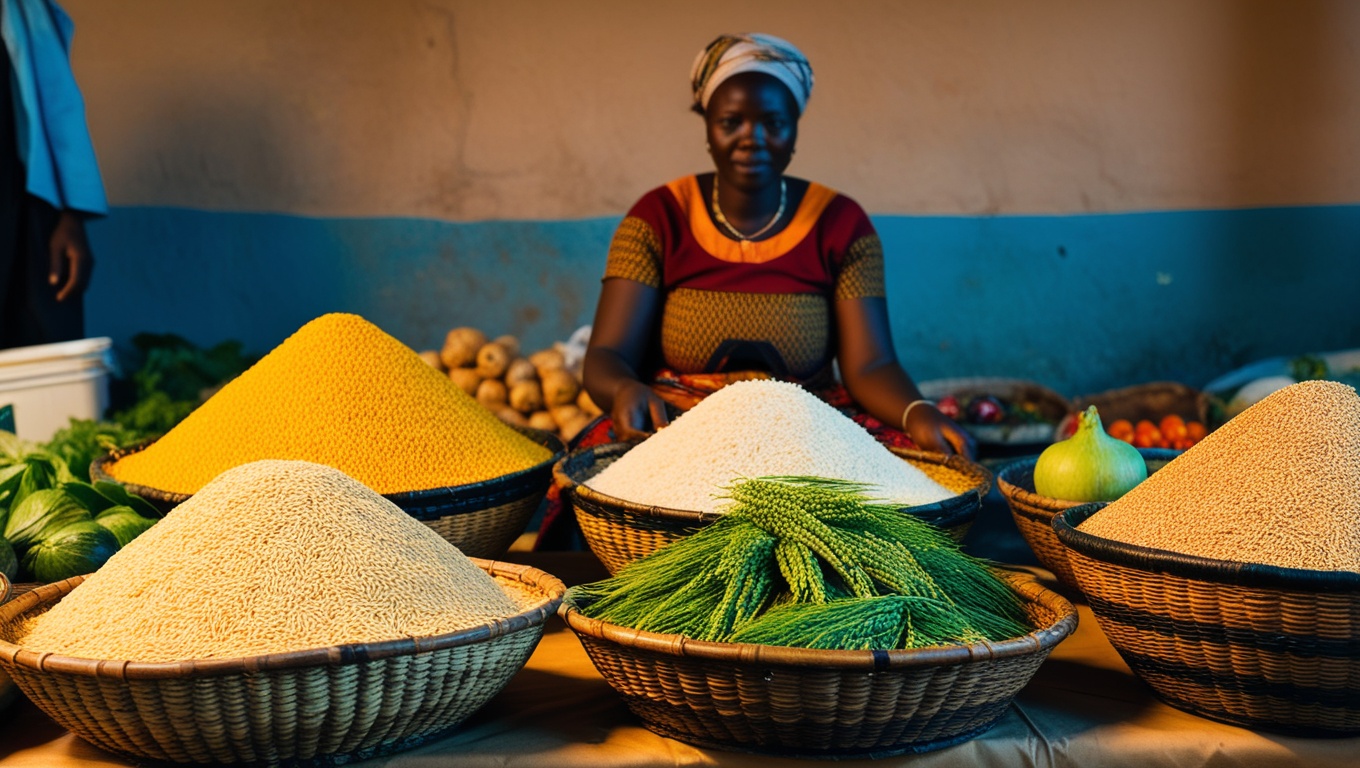
One point is decisive for action: national agricultural figures are averages, and averages hide what matters most. Behind a national yield or income lie considerable gaps between a farm supported by a cooperative and an isolated producer, between an irrigated zone and a rain-fed one, between men and women who do not enjoy equal access to land, inputs and advice. An aggregate statistic, useful for comparing countries, does not say where to act within a country. This is exactly what geolocated and disaggregated data corrects: it turns a national average into a map of gaps, and a map of gaps into an investment roadmap. Without this granularity, the same public budget produces very uneven effects depending on whether it targets zones with high untapped potential or those already near their ceiling. Digital collection did not invent this need for precision, but it is the first tool that makes it practicable at scale and at a sustainable cost.
The CRAD angle: from the connected field to the dashboard
This is the conviction that guides CRAD's work on agricultural value chains: data has value only if it is captured in the field, geolocated, checked at source and renewed season after season. The connected field we deploy rests on trained enumerators equipped with geolocated tablets, forms designed with their consistency checks, collection that works offline in poorly covered areas, and dashboards that report results while collection is still under way. This complete chain, from the farmer to the decision-maker, is precisely what we mobilize on value chains such as cotton, cashew or pineapple, for funders who demand verifiable and repeatable evidence of impact.
One caveat, however, must accompany this enthusiasm. The connected field is not magic. Technology accelerates and makes reliable a sound method; it does not create one. A poorly designed form will only produce useless data faster; geolocation without an analysis plan will remain a dot on a map; a dashboard fed with poorly chosen indicators will give the illusion of steering without its reality. The value lies upstream, in the thinking about the indicators truly useful to the decision, and downstream, in the ability to turn data into a choice. Between the two, the digital tool saves time, money and reliability, provided it is never mistaken for the method itself.
Ultimately, the shift to digital collection is not a matter of technological fashion: it is a change of regime in the knowledge of agricultural value chains. The countries and programmes that make it stop describing agriculture after the fact and start steering it in real time. In economies whose agriculture is the leading employer, this gain of a few days on delay and a few points on reliability is not measured in spreadsheet rows: it is measured in better-protected harvests, better-spent budgets and decisions finally made on the reality of the field rather than its memory.
Key takeaways
- Agriculture still employs 35 to 73 percent of West African workers and accounts for up to a third of GDP, yet remains one of the least well-measured sectors: most low-income countries do not produce the core agricultural indicators of the Zero Hunger SDG.
- Mobile digital collection (ODK, KoboToolbox, CommCare, Survey Solutions) captures, geolocates and checks data in the field, cutting the delay from several months to a few days.
- In African settings, digital sharply reduces errors: the share of questionnaires marred by an error falls from 33 percent to 8 percent in South Africa, for example, at half the cost per reliable data point, recouped within six months.
- Rural connectivity remains the bottleneck: 95 percent network coverage but only 27 percent mobile internet usage in sub-Saharan Africa, and rural usage half that of cities. Collection must therefore work offline.
- Geolocated and disaggregated data turns a national average into a map of gaps, and a map of gaps into an investment roadmap: this is where the effectiveness of agricultural public spending is decided.
Recommendations for West African decision-makers
- Generalize digital collection for all public agricultural surveys (seasons, censuses, project monitoring), drawing on the sector's proven and largely free tools rather than developing costly proprietary solutions.
- Make geolocation and disaggregation (by zone, by sex, by farm type) a standard requirement, in order to map gaps within countries and concentrate investment where untapped potential is highest.
- Design every system for offline use and invest in rural connectivity and electrification, without which the connected field cannot reach the most remote farms.
- Invest in skills before tools: train enumerators and form designers, because a bad digitized questionnaire only produces useless data faster.
- Make reducing reporting delay an explicit policy objective, aiming for usable season data within a few days rather than a few months, the condition for real-time steering.
- Embed national value chains in regional and international statistical modernization initiatives (such as 50x2030) to pool methods, tools and costs, and make agricultural data a public good renewed season after season.
Sources
- World Bank, employment in agriculture (SL.AGR.EMPL.ZS, ILO estimate)
- World Bank, agriculture value added as % of GDP (NV.AGR.TOTL.ZS)
- 50x2030 Initiative to close the agricultural data gap (World Bank, FAO, IFAD)
- FAO, The 50x2030 Initiative to Close the Agricultural Data Gap
- GSMA, The Mobile Economy Sub-Saharan Africa 2024 (coverage and usage gap)
- GSMA Mobile for Development, rural/urban usage gap in sub-Saharan Africa
- Randomized evaluation of electronic versus paper data capture, public-health survey, Ethiopia (JMIR, 2019)
- Open-source electronic data capture: accuracy and cost-effectiveness versus paper, South Africa (PMC, 2015)
- Open Data Kit (ODK), open-source mobile data collection platform
- KoboToolbox, data collection tool for development and humanitarian work
- World Bank, Survey Solutions (computer-assisted survey software)
- African Cashew Alliance, cashew processing in West Africa 2025