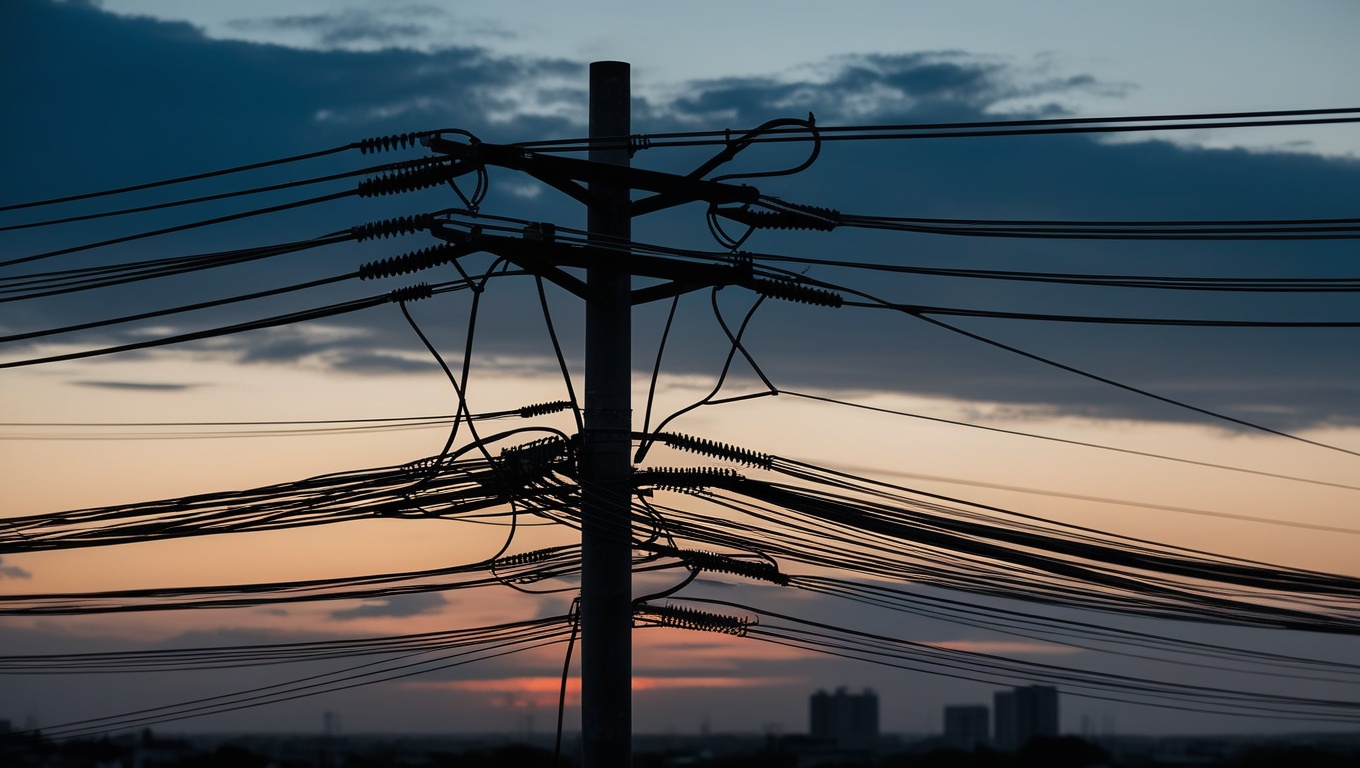
Grid losses: the electricity that is produced but never arrives
Worldwide, roughly 7% of the electricity produced is lost between the power plant and the meter (6.5% in 2024 according to the World Bank). In West Africa, this figure shifts into another category altogether: Benin let 58.6% of its output slip away in transmission and distribution losses in 2023, Niger 45.8% and Togo 32.5%, five to eight times the global benchmark. In other words, more than one kilowatt-hour out of every two produced in Benin never reaches the user who would pay for it. Every unit lost is fuel burned, a dam turbined or an import paid for nothing, at the very moment these same systems ration electricity through load-shedding. This is not a technical inevitability: Ghana (11.2%), Senegal (13.1%) and Cote d'Ivoire (13.7%) demonstrate that a West African grid can approach international standards. The question, then, is not whether the region can plug its leaks, but whether it decides to measure, and then to repair, what it currently lets evaporate on its lines.
One regional grid, performance that ranges from single to fivefold
World Bank data (indicator EG.ELC.LOSS.ZS, IEA source) for 2023 depict a region split in two. At the top of the loss rankings, Benin peaks at 58.6% of output lost in transmission and distribution, one of the highest rates in the world, followed by Niger (45.8%) and Togo (32.5%). At the bottom, a group of markedly more efficient grids: Ghana (11.2%), Senegal (13.1%), Cote d'Ivoire (13.7%) and Nigeria (14.2%), with Burkina Faso (17.1%) in an intermediate position. Between Benin and Ghana, the gap is a factor greater than five. What is striking is that this hierarchy does not match any obvious physical geography: neighbouring countries, whose grids are sometimes interconnected, end up at opposite ends of the spectrum. A grid's performance therefore owes less to its geography than to the state of its infrastructure, the quality of its metering and the rigour of its collection. That is good news, because these three levers depend on decisions and investment, not on fate.
Against the global benchmark, the scale of the shortfall
To grasp the scale of the anomaly, it must be set against what the rest of the world achieves. The global average for transmission and distribution losses stands at around 7% (6.9% in 2023, 6.5% in 2024 according to the World Bank). This is the reference point against which West Africa sits two to eight times higher. Ghana, at 11.2%, is only about 1.6 times the world average, a reasonable overshoot for a developing region. Benin, however, is at more than eight times. Between the two, each country reveals its margin: bringing Benin down even to Togo's level would already free up a considerable share of the output lost today. The shortfall is therefore not uniform; it concentrates in a handful of grids whose leaks, both technical and commercial, reach an intensity that few power systems in the world still experience.
More than one kilowatt-hour out of every two produced in Benin never reaches the user who would pay for it. The world, for its part, loses only one in fifteen.
Technical losses and commercial losses: two leaks, two remedies
Behind an overall rate lie two blocks of a very different nature, which it is crucial not to confuse. Technical losses arise from the physics of the grid: Joule heating in dilapidated, undersized or overly long lines, and inefficient transformers. They are corrected through investment in infrastructure. Non-technical losses, known as commercial losses, cover electricity theft (illegal connections, tampered meters), metering errors and bills that are never collected. They are corrected through metering, control and customer management. The two call for distinct responses, mobilising different budgets and skills. A country that loses mostly through dilapidation does not have the same roadmap as one that loses mostly through theft and unpaid bills. Hence the importance of measuring the two layers separately, something the aggregated average, on its own, can never allow.
Nigeria offers the clearest illustration of this stratification. The World Bank measures only around 14.2% of transmission and distribution losses there. But the national regulator, NERC, measures a broader reality: in the second quarter of 2023, distributors posted an ATC&C figure (technical, commercial and collection losses) of 38.4%, of which 24.5% was non-collection, that is, energy delivered but never paid for. In the third quarter of 2024, billing efficiency capped at 82%, meaning nearly 18% of the energy received by distributors is never billed to the end customer. These three figures, 14%, 18% and 38%, are all accurate: they simply do not measure the same thing. Confusing the technical loss with the loss actually borne by the sector leads to underestimating the hole by half.
This distinction is not merely an accounting subtlety, because it governs the very nature of the public response. A predominantly technical loss is addressed through civil and electrical engineering: replacing a cable, doubling a transformer, shortening a line. It can be planned, budgeted and amortised. A predominantly commercial loss, by contrast, falls to governance, management information systems and sometimes public order, where electricity theft is organised or tolerated. An operator can thus renovate its entire network of lines and keep losing a quarter of its revenue if no one pays their bill. This is precisely the trap into which reforms fall when they finance infrastructure renewal alone without simultaneously tackling metering and collection: they reduce the visible loss while leaving intact the loss that costs the most. Diagnosing the respective share of the two layers is therefore the first act of an effective strategy, and that act is above all an act of measurement.
The cost of inaction: a black hole measured in billions
These percentages have a price, and it is massive. The World Bank estimates that sub-Saharan African utilities lose 23% of energy from their inefficiencies alone, against 10% on average worldwide, at a cost of around 3.3 billion dollars a year. This amount finances neither a power plant, nor a line, nor an additional subscriber: it evaporates. In Ghana, the distribution company ECG accumulated around 2.05 billion cedis (GHS) in collection losses over the first nine months of 2023 alone, and its overall losses, technical, commercial and collection combined, reached 32% of its electricity sales, their highest level in more than two decades. These holes do not stay confined to the operators' balance sheets: they feed the quasi-fiscal deficit of states, which must subsidise structurally loss-making companies, drain investment in the grid itself, and translate into the load-shedding that curbs economic activity. Grid loss is thus an invisible tax that the whole economy pays.
The cost of inaction is not limited to the companies' balance sheets: it spreads to the whole economy and weighs on access to energy itself. An operator that loses half its output can neither finance the extension of the grid to the neighbourhoods and villages still without electricity, nor maintain service quality for customers already connected. Commercial losses push tariffs upwards for the users who do pay, since the bill for unpaid consumption and theft is ultimately passed on to honest payers or to the taxpayer through public subsidy. They thus create a cycle of inequity in which the connected customer who settles their bill implicitly finances the one who defrauds. At the macroeconomic level, the load-shedding that stems from the sector's financial fragility cuts into firms' productivity, discourages industrial investment and raises the cost of the expensive fallback to generators. Every point of untreated loss is therefore, in the end, a brake on growth and on energy inclusion.
What a national average does not tell you
A national loss figure is an average, and averages mask two truths essential for action. The first is the confusion of definitions already mentioned: the World Bank measures only transmission and distribution (14% in Nigeria), whereas the loss actually borne by the sector, unpaid bills included, exceeds 38%. Depending on the figure cited, one describes an infrastructure problem or a collection problem, two diagnoses that do not call for the same budgets. The second is the extreme volatility of West African series. Togo went from 71.3% of losses in 2011 to 15.9% in 2017, then to 32.5% in 2023. Benin swings between 26.6% and nearly 90% depending on the year. Such jumps do not reflect genuine annual reversals of performance, but the fragility of measurement systems and the instability of the grids. An isolated figure therefore has little meaning: only the multi-year trajectory is interpretable.
A regional factor further complicates this reading. In Togo as in Benin, part of the electricity is imported through the Communaute Electrique du Benin (CEB), the binational transmission body. This architecture complicates the attribution of losses between binational transmission and national distribution, and can artificially inflate national rates in certain years. Comparing two countries without accounting for who produces, who transmits and who distributes is to risk comparing different perimeters under a single heading.
Proof by example: when a grid converges towards the benchmark
The best antidote to fatalism is to look at those who are making progress. Over the period, several West African grids have methodically reduced their losses to move closer to international standards. Ghana went from 22.7% of losses in 2010 to 11.2% in 2023, a gain of 11.5 points in thirteen years. Cote d'Ivoire fell from 20.2% to 13.7% (6.5 points gained), Senegal stabilised around 13 to 16% and Burkina Faso gained nearly 11 points over the period. These downward trajectories, steady and sustained, contrast radically with the sawtooth patterns of Benin or Niger. They prove that a West African grid is not condemned to its losses: with sustained investment in infrastructure and rigorous commercial management, convergence towards the global benchmark is achievable within a decade. The difference between the two groups of countries lies not in nature, but in the consistency of the effort.
What distinguishes these virtuous trajectories lies first in their regularity, and this regularity is in itself a signal of governance. A slow but continuous decline, year after year, reveals an operator that invests in its grid in a planned way, that progressively makes its metering reliable and that maintains its customer management over time, shielded from political jolts. Conversely, a series that jumps in every direction often betrays discontinuous steering, data reconstructed after the fact and an absence of direction. The contrast between the two groups of countries is therefore not only a performance gap: it is a gap in the institutional maturity of the electricity sector. And this maturity, precisely because it can be read in the data, can be built, tracked and proven to funders.
Breaking down the hidden costs to know where to focus the effort
Grid losses are only one component of the hidden costs that weigh down African electricity sectors. The World Bank's analysis of some twenty countries attributes the total to three causes: undertariffing (electricity sold below its cost of production) accounts for 67%, excessive transmission and distribution losses for 22%, and non-collection for 11%. Technical and commercial loss is therefore not the only ailment, but it represents nearly a quarter of a deficit that, elsewhere, is measured in billions. The value of this breakdown is strategic: it indicates where each unit of effort yields the best return. A country whose deficit comes mainly from undertariffing must first reform its tariff schedule; a country whose hole comes from leaks and unpaid bills must first invest in metering and control. Without this breakdown, reform risks treating the most visible symptom rather than the dominant cause.
It must nonetheless be stressed that this breakdown itself is debated. The 67 / 22 / 11 split is that, explicitly documented, of the twenty-country analysis; more recent syntheses cite rather on the order of 40% for undertariffing and 30% for grid losses, depending on the sample and the year chosen. The orders of magnitude diverge, but the message does not change: technical and commercial losses are a heavy and documented component of the deficit, never negligible, whatever the source.
The loss hidden inside the national rate: the Benin case
Benin's overall loss rate, as published by the World Bank, adds together transmission and distribution and proves highly volatile. A finer reading, at the level of the distribution company alone, sheds more light on action. The benchmark from the MCC energy compact, established by Mathematica, places the technical and commercial losses of Benin's distribution grid (SBEE) at around 20 to 24% combined in 2019, excluding transmission. This targeted measure, although lower than the aggregated national rate, precisely identifies the link where action is needed: distribution, where theft, faulty meters and unpaid bills are concentrated. It is also the scale at which an intervention is operationally manageable, unlike a national aggregate that mixes perimeters and imports the volatility of binational transmission. Moving from the country rate to the utility rate, and then to the rate by distribution zone, is the condition for a reform that hits its target.
- Technical losses. They arise from dilapidated lines, undersized transformers and excessive transmission distances. Remedy: investment in renewing and reinforcing the grid.
- Theft and illegal connections. Tampered meters and clandestine hook-ups feed the commercial loss. Remedy: smart metering, field control and geolocation of fraud zones.
- Non-collection. Energy delivered, billed or not, but never paid for (24.5% in Nigeria in the second quarter of 2023). Remedy: billing efficiency, prepayment and rigorous customer management.
The CRAD angle: you only reduce what you measure
The battle against grid losses is first a battle of data. The West African series that jump from 27% to 90% from one year to the next do not describe grids that collapse then recover: they describe defective measurement systems. Yet no investment plan, no tariff reform, no anti-fraud strategy can be steered on such high statistical noise. The prerequisite for any credible action is therefore to make the measurement reliable: to distinguish clearly between technical and non-technical losses, to track billing efficiency continuously, and to geolocate theft zones in order to concentrate controls there. This is precisely CRAD's line of work: to design, with funders and regulators, the metering and monitoring-and-evaluation systems that turn a volatile national rate into an actionable map, zone by zone and layer by layer.
A grid that shows 27% of losses one year and 90% the next has not changed its nature: it has a measurement problem before it has an electricity problem.
This requirement for measurement has a direct bearing on financing. A funder does not commit hundreds of millions to the rehabilitation of a grid without a reliable baseline and a monitoring system that will prove the effect of the investment. Making loss series reliable, today too volatile to be actionable, is therefore the key that unlocks compacts and concessional loans. Data is not an accessory to West African energy reform: it is its entry condition.
Key takeaways
- The world loses roughly 7% of its electricity between the power plant and the meter; Benin loses 58.6%, Niger 45.8% and Togo 32.5% (2023), five to eight times more.
- Regional gaps are massive: from Benin (58.6%) to Ghana (11.2%), the ratio exceeds five, with no obvious link to geography.
- Losses break down into technical leaks (grid dilapidation) and non-technical ones (theft, unpaid bills): in Nigeria, the real loss reaches 38.4% (ATC&C) where the international indicator sees only 14%.
- The cost is colossal: 23% of energy lost in sub-Saharan Africa (against 10% elsewhere), around 3.3 billion dollars a year in inefficiencies.
- It is not an inevitability: Ghana halved its losses in thirteen years (22.7% to 11.2%), proving that a lasting decline is a matter of policy held steady.
Recommendations for West African decision-makers
- Make the measurement reliable first: put in place systematic metering at the grid's strategic points and publish stable, auditable loss series, the condition of any investment plan and any funder financing.
- Distinguish and track technical and non-technical losses separately, as well as billing efficiency, following the example of the Nigerian regulator's ATC&C reporting, to target every euro on the dominant cause.
- Move from the national rate down to the rate per company and per distribution zone (in the manner of the SBEE benchmark from the MCC compact), in order to concentrate anti-fraud controls and rehabilitations where the pool of losses is greatest.
- Invest in renewing dilapidated infrastructure (lines, transformers) while deploying smart metering and prepayment to attack physical leaks, theft and non-collection simultaneously.
- Address grid losses within an overall reform of hidden costs, combining loss reduction, sustainable tariff adjustment and improved collection, rather than acting on a single lever.
- Clarify, at the ECOWAS level and through the CEB, the attribution of losses between binational transmission and national distribution, so that comparisons between countries cover homogeneous perimeters and genuinely inform decisions.
Sources
- World Bank (IEA), Electric power transmission and distribution losses (% of output), EG.ELC.LOSS.ZS
- World Bank, EG.ELC.LOSS.ZS, Togo
- World Bank, EG.ELC.LOSS.ZS, Benin
- World Bank, Making Power Affordable for Africa and Viable for Its Utilities
- World Bank, Financial Viability of Electricity Sectors in Sub-Saharan Africa (WPS7788)
- NERC via Vanguard, DisCos ATC&C losses 38.4% Q2 2023
- NERC via Nairametrics, billing efficiency and unbilled energy
- Energy Commission (Ghana) via MyJoyOnline, ECG losses 32%
- MyJoyOnline, ECG collection losses 2 billion GHS 2023
- MCC / Mathematica, Benin Power Compact, Baseline Report (distribution losses 20-24%)
- IEA, Africa Energy Outlook 2022, Key findings