Gas flaring: burning a fortune and paying twice
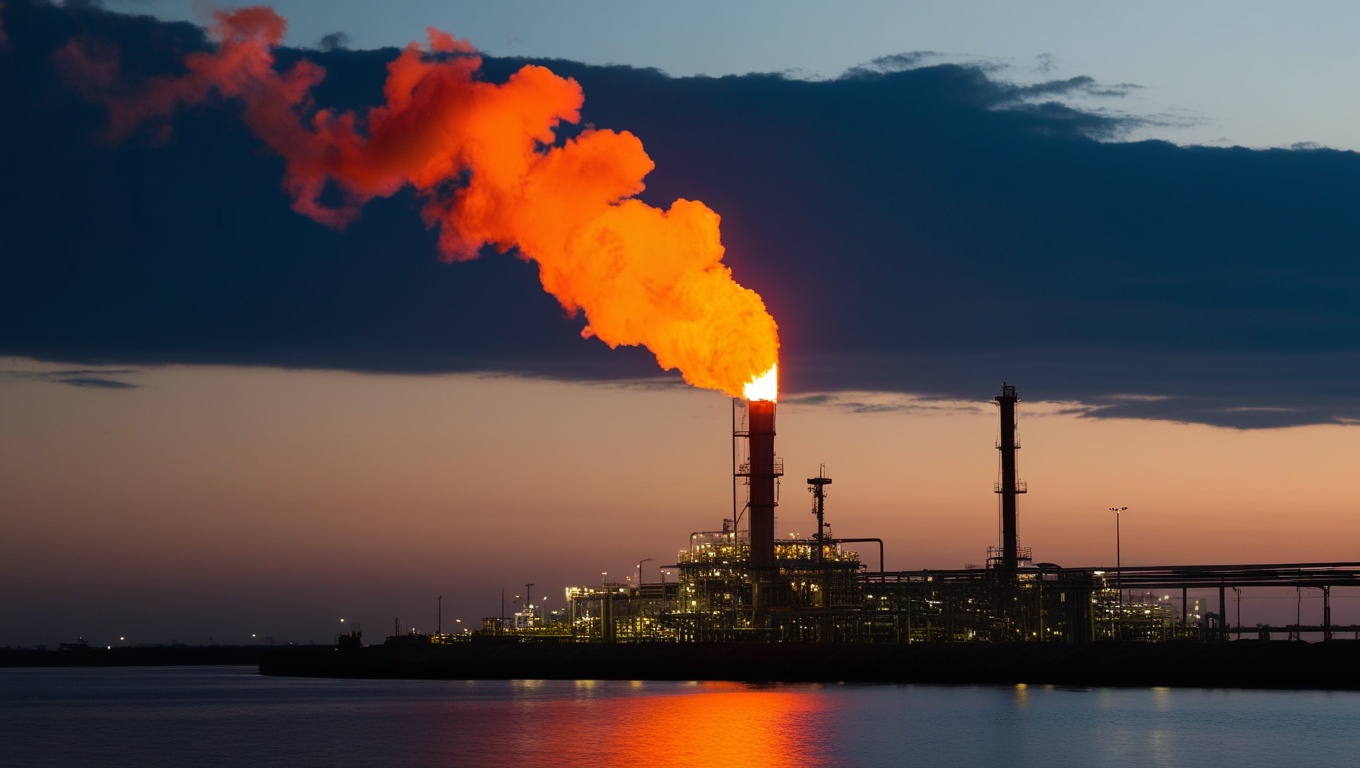
In 2024, humanity burned for nothing 151 billion cubic metres of natural gas, the highest volume since 2007. This gas, flared for lack of valorisation, is equivalent to almost the entire annual gas consumption of Africa (162 billion m3), on a continent where more than half a billion people have no reliable access to electricity. The energy thus gone up in smoke was worth about 63 billion dollars and released 389 million tonnes of CO2 equivalent into the atmosphere. This is the very meaning of the phrase “paying twice”: the resource is lost the moment it burns, then the climate foots the bill. Nigeria concentrates this paradox. After cutting its flaring by more than two thirds in a decade, the country has just relapsed, while its Ghanaian neighbour is about to shut off the valve. This West African contrast has nothing geological about it: it tells a story of political will and execution.
Flaring, a waste measured from space
Routine flaring consists of burning the gas associated with oil, for lack of infrastructure to reinject it, use it on site or bring it to a market. It is a practice as old as the oil industry, and long invisible in official statistics, because no operator has an interest in declaring what it destroys. The break came from the sky: the World Bank's Global Gas Flaring Tracker reconstructs the flared volumes each year from satellite observations (NOAA's VIIRS sensors), the only independent and global measurement of the phenomenon. For the first time, the data escapes self-reporting and becomes enforceable.
The picture it paints is one of a structural problem, not a cyclical one. After a trough at 139 billion m3 in 2022, global flaring rose again: 148 billion in 2023, then 151 in 2024. Oil production is increasing, and flaring follows it, or even outpaces it. In other words, the industry continues to burn a stable share of its resource, as if three decades of climate commitments had never happened. The global curve is not bending: it is climbing back up.
A handful of countries, the bulk of the problem
Flaring is not an evil spread evenly across the oil-producing planet: it is spectacularly concentrated. The top nine flaring countries alone account for 76% of global flaring, whereas they do not even represent half of oil production. This dissociation is crucial: it shows that flaring is not an inevitability tied to the volume extracted, but the result of investment and regulatory choices specific to each country. Where the decision is made to capture the gas, it is captured; where it is left unaddressed, it burns.
This concentration has even intensified at the top. The combined share of the three leading flarers (Russia, Iran, Iraq) rose from about a third of the global total in 2012 to nearly half in 2024, with Iran recently overtaking Iraq to become the world's second-largest flarer. In other words, the problem is not diluted as global production spreads out: it becomes denser among a few actors that have not undertaken the valorisation of their gas. For West Africa, this finding has practical significance: it confirms that the lever for action is national and regulatory, and that a determined country can exit the list of poor performers without waiting for a global agreement.
The Nigerian paradox: the volume reassures, the intensity indicts
Judging a flaring country by its raw volume alone is misleading, because a large producer will mechanically flare more than a small one. The right measure is intensity: how many cubic metres of gas are burned for each barrel of oil extracted. This is where Nigeria falls behind. In 2024, its intensity reached 12.0 m3 per barrel, up from 11.0 the previous year, more than double the global average (5.1 m3/barrel) and nearly seven times that of the United States (1.8). Nigeria therefore does not flare a lot because it produces a lot: it flares a lot because it poorly valorises its gas.
The paradox worsened in 2024. Nigerian flaring jumped by 12%, the second-largest increase worldwide, while the country's oil production rose only 3%. Burned gas therefore increased four times faster than oil produced, which rules out the mechanical explanation of a mere surge in activity. The cause lies elsewhere, in the very organisation of the sector: the national oil company alone accounts for 60% of national flaring and 75% of the 2024 rise. The problem has an identified centre of gravity.
What the previous decade proves: acting is possible
The 2024 relapse would be discouraging if Nigeria's long history did not tell exactly the opposite. In 2015, the country still flared more than 23 billion m3, or 13% of the global total: it was then one of the biggest gas wasters on the planet. In less than a decade, this volume was cut more than threefold, falling to around 5 to 6 billion m3 in the early 2020s. This spectacular decline is proof, from Nigeria's own record, that flaring is not a geological curse: it recedes as soon as a policy decides on it and holds firm.
This partial success was not spontaneous. It accompanied a series of commitments and mechanisms: endorsement of the World Bank's “Zero Routine Flaring by 2030” initiative in 2016, a penalty regime (2 dollars per 1,000 cubic feet flared above 10,000 barrels per day), and a programme to commercialise flared gas, the NGFCP, which awarded 49 sites to 42 candidates to target a capture of 250 to 300 million cubic feet per day. Nigeria therefore has the arsenal. The 2024 relapse does not say that these tools are useless, but that they are not enough without sustained execution and independent monitoring of actual volumes.
Nigeria proved that an oil giant can cut its flaring threefold. The 2024 relapse proves that an unconsolidated gain is lost again. Between the two, there is not geology, there is political consistency.
The West African contrast: Ghana shuts off the valve
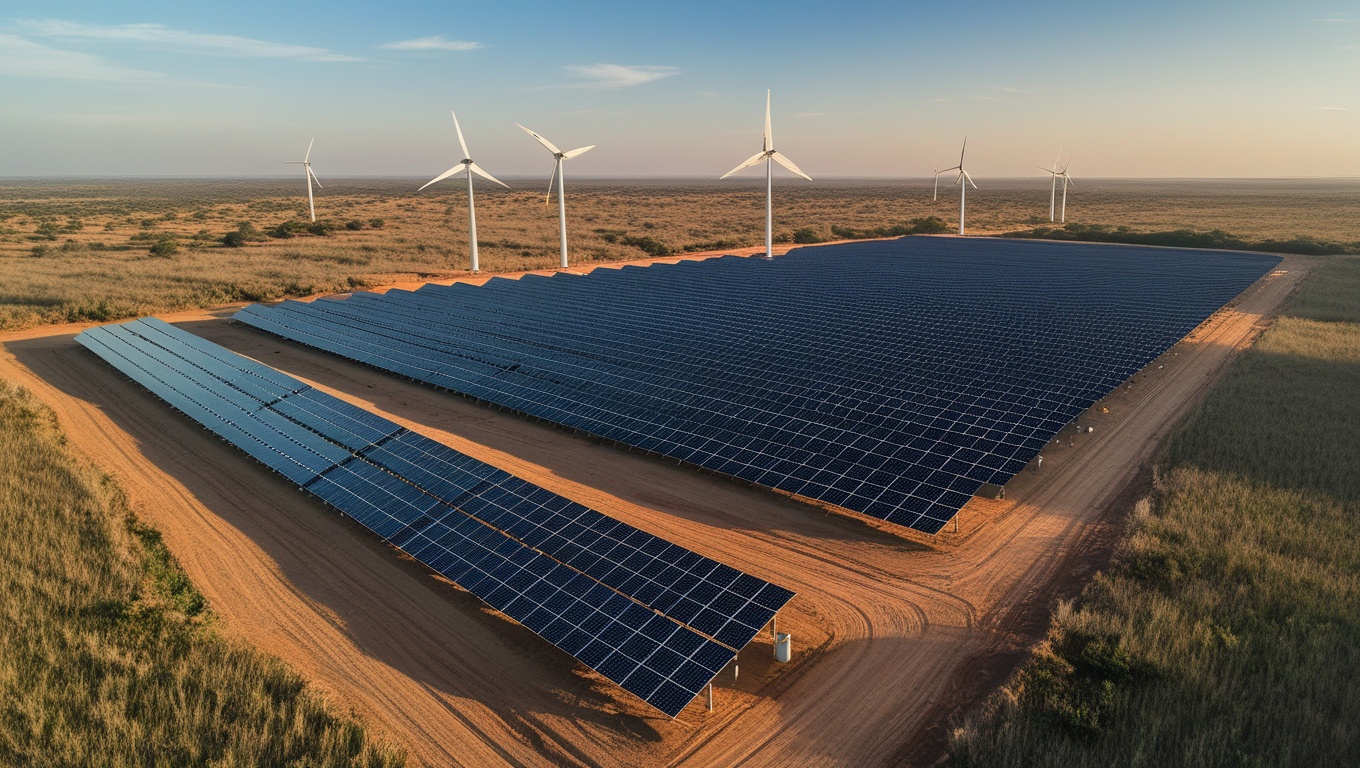
To measure what political will is worth, one only has to cross the border. In 2024, Ghana flared only 0.81 billion m3 (28.5 billion cubic feet), or 10.4% of the gas it extracted. Above all, Accra set an explicit course: ending routine flaring as early as 2026, four years before the 2030 international deadline that Nigeria is struggling to approach. Ghana, a more modest producer, turns its associated gas into an energy asset rather than into smoke, precisely because it chose to do so early and to give itself the means to do it.
The Ghanaian demonstration is all the more instructive because it concerns a ratio, not a mere volume. Flaring 10.4% of the gas extracted remains improvable, but the stated objective of ending routine flaring as early as 2026 signals a deliberate downward trajectory, at odds with the Nigerian relapse. Ghana enjoys no geological privilege that would exempt it from the trade-off: like any producer, it must choose between investing in the capture of associated gas or letting it burn. It chose the first term, and above all it enshrined it in a dated and public timetable, which makes its commitment verifiable.
The rest of West Africa completes the picture by its absence. Benin, Senegal, Côte d'Ivoire, Niger, Mali, Burkina Faso and Togo have no significant flaring, for lack of comparable oil production. But today's exemption is no guarantee for tomorrow: several of these countries are entering hydrocarbon production, led by Senegal. The Nigerian lesson and the Ghanaian example are addressed directly to them: it is at the moment of launching a sector that it is decided whether gas will be valorised or burned, because it is far more costly to make up for missing infrastructure than to plan it from the outset.
Paying twice: lost value and the climate bill
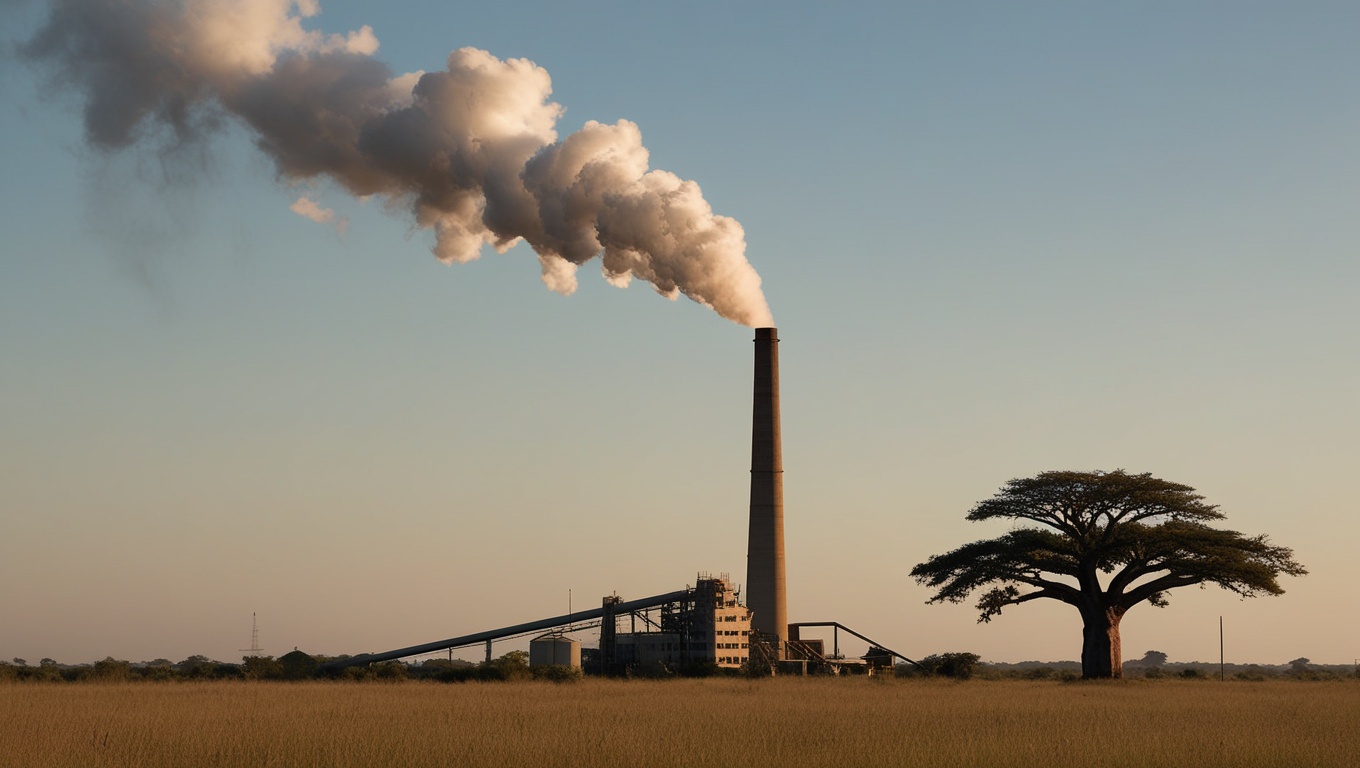
Flaring inflicts a double penalty, and both components can be quantified. The first cost is the resource itself. Globally, the energy burned in 2024 was worth about 63 billion dollars. For Nigeria alone, the national oil-spill detection agency (NOSDRA) values the gas flared in 2024 at 1.05 billion dollars, the equivalent of about 30,100 GWh of electricity, in a country suffering from a chronic power deficit and where access to energy remains the primary obstacle to development. Every flare is a power plant that was not built.
The second cost is the climate. Flaring released 389 million tonnes of CO2 equivalent in 2024, including 46 million tonnes in the form of unburned methane. This last figure is the most insidious. It is generally assumed that flares burn gas at 98% efficiency, but empirical research measures an actual efficiency of only 91.1%. The gap may seem small; it is not. The methane that escapes combustion is a greenhouse gas about 80 times more powerful than CO2 in the short term. Flaring therefore warms the planet more than is accounted for, and its actual climate impact is systematically underestimated.
What averages conceal: overstated efficiency, fragile data
The global figure of 151 billion m3 is an aggregate, and like any aggregate it smooths over realities that public action cannot ignore. Three blind spots deserve to be brought to light. The first is combustion efficiency: as long as the convenient assumption of 98% is retained, released methane is undercounted; the actual measurement of 91.1% changes the order of magnitude of the climate problem and shifts the priority towards leak detection, not only towards reducing visible flames.
The second blind spot is the very precision of the volumes. Public reports round figures off (5 billion m3 for Nigeria in 2022, 6 in 2023), and the 2024 figure (about 6.7 billion) is an estimate derived from the 12% increase reported by the World Bank, for lack of an absolute value published in the clear. Likewise, the value of the wasted gas varies greatly depending on the reference price used: the range cited for 2023 runs from 9 to 64 billion dollars depending on the price assumption, the gap being down to valuation, not volume. These uncertainties do not call the trend into question, but they are a reminder that a serious policy needs local, verified and up-to-date data, not just global averages.
- Combustion efficiency. Assumed at 98%, measured at 91.1%: unburned methane, a gas about 80 times more warming than CO2 in the short term, is therefore largely underestimated in official inventories.
- Precision of volumes. National volumes are rounded and sometimes inferred from a rate of change; Nigeria's 2024 figure is an estimate, not a figure published in the clear.
- Economic valuation. The value of the lost gas depends on the reference price chosen (US domestic price or European import price), hence wide ranges for the same physical volume.
The cost of inaction: energy lost on a continent that lacks it
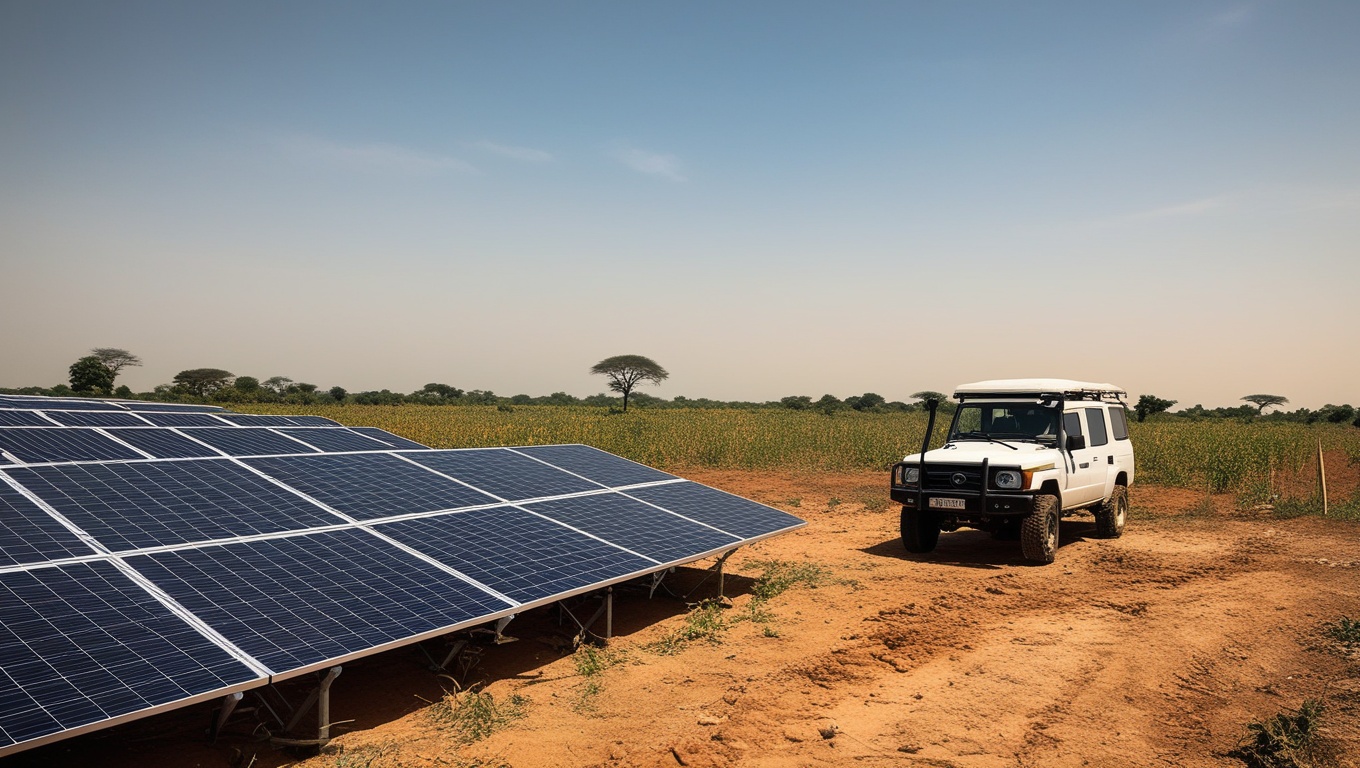
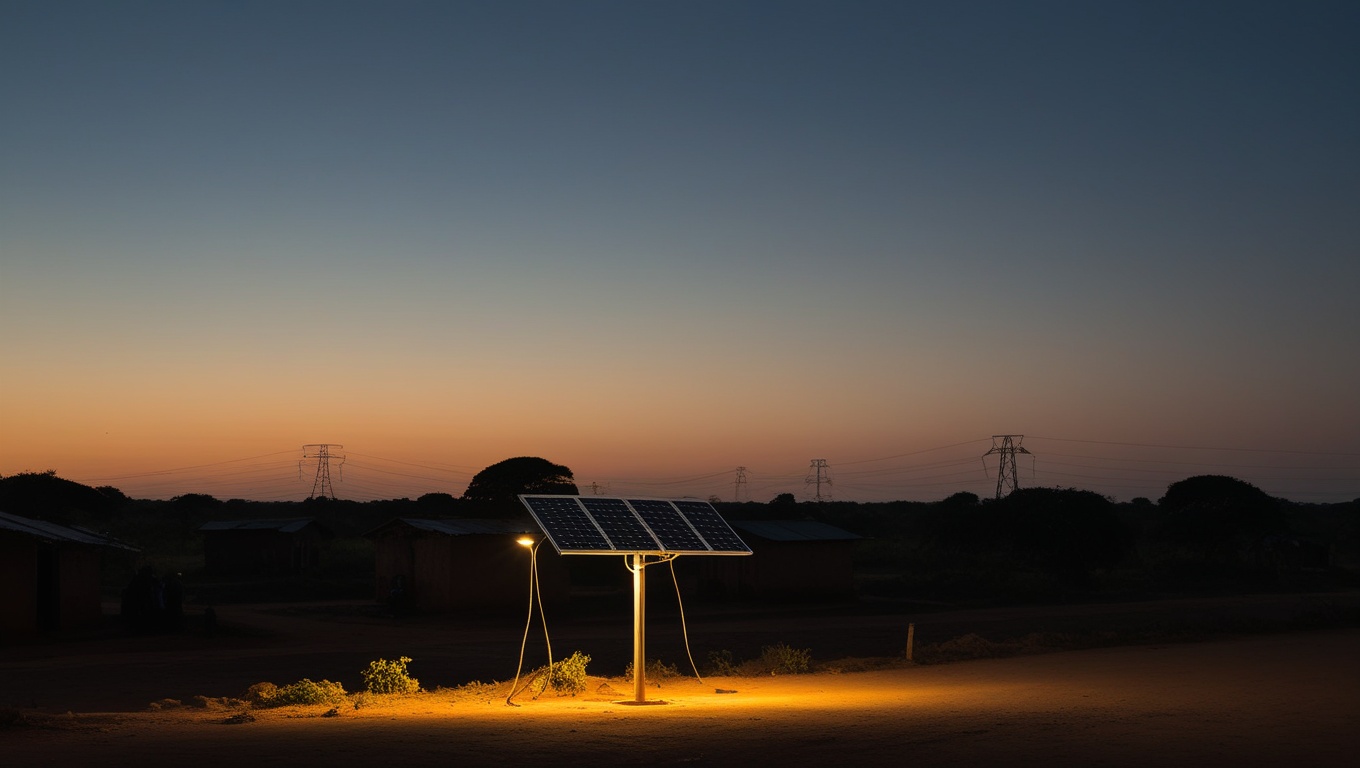
Inaction has a price, and it is measured against unmet needs. The gas flared worldwide in 2024 represented 93% of the annual gas consumption of Africa as a whole. Put differently: the energy burned without use on the planet would have almost sufficed to cover an entire year's African gas demand, on a continent where more than 500 million people live without reliable access to electricity. Flaring is not merely an abstract climate problem, it is a scandal of resource allocation: what is cruelly lacking a few hundred kilometres away is destroyed in one place.
For West Africa in particular, every year of unchecked Nigerian flaring is a missed opportunity for regional energy security. Captured gas could power plants, industry and fertiliser production, and reduce dependence on costly imports. Conversely, every flare that keeps burning turns a domestic asset into a climate liability. The cost of inaction is therefore not zero: it is that of destroyed wealth, a prolonged power deficit and accelerated warming, all borne by the populations least responsible for the problem.
The CRAD angle: turning a satellite image into a decision dashboard
The Nigerian case perfectly illustrates the gap between commitment and execution. The country endorsed the “Zero Routine Flaring” initiative, equipped itself with a penalty regime and a commercialisation programme, and yet its flaring rose again in 2024. This is not a deficit of ambition, it is a deficit of monitoring. As long as a country does not measure its actual volumes independently, does not quantify the lost value and does not make these figures enforceable against its operators, its commitments remain intentions. The World Bank's satellite data offers precisely this neutral basis: it still has to be translated into steering.
This is the conviction that guides CRAD's approach to climate and energy issues. A satellite observation only has value, for a decision-maker, if it becomes a dashboard: volumes flared by site and by operator, lost economic value, associated emissions, gap to official targets, all of it tracked campaign after campaign and cross-referenced with field data. CRAD supports West African states and donors in this monitoring and evaluation work on policies: measuring what actually burns, quantifying what it costs, and turning global data into a local roadmap. This is the difference between declaring an ambition and being able to account for it.
Key takeaways
- In 2024, the world flared 151 billion m3 of gas, the highest level since 2007, or 93% of Africa's annual gas consumption and 63 billion dollars of destroyed energy.
- Nigeria cut its flaring more than threefold since 2015 (from 23 to about 6 billion m3), proof that acting is possible, but it relapsed by 12% in 2024 while its production rose only 3%.
- Nigeria's flaring intensity (12 m3 per barrel) is more than double the global average (5.1) and nearly seven times that of the United States (1.8): the problem lies in gas valorisation, not in the volume produced.
- Ghana flared only 0.81 billion m3 in 2024 and is aiming to end routine flaring as early as 2026, four years before the international deadline: the regional contrast is a political choice.
- The actual combustion efficiency (91.1% instead of the assumed 98%) means that released methane, about 80 times more warming than CO2 in the short term, is largely underestimated.
Recommendations for West African decision-makers
- Make independent satellite measurement (Global Gas Flaring Tracker, VIIRS sensors) the official and enforceable reference for flared volumes, rather than operators' declarations alone, and publish these figures site by site.
- Translate existing commitments into sustained execution: in Nigeria, effectively enforce the penalty regime and accelerate the NGFCP commercialisation programme (49 sites awarded), targeting the national company that accounts for 60% of flaring.
- Anticipate in entrant countries (led by Senegal): enshrine the ban on routine flaring and the obligation to valorise associated gas from the initial contracts and infrastructure, on the Ghanaian model of a targeted halt in 2026.
- Systematically quantify the double loss, the value of destroyed energy and the climate cost of methane, to turn an abstract environmental issue into an economic trade-off readable by finance ministries.
- Integrate methane-leak measurement (actual efficiency of 91.1%, not 98%) into national inventories, so as to stop underestimating the actual climate impact of flares and to guide priorities.
- Build regional monitoring and evaluation dashboards cross-referencing satellite data, lost value and official targets, to steer West African energy security at ECOWAS scale rather than country by country in isolation.
Sources
- World Bank, 2025 Global Gas Flaring Tracker Report (2024 data)
- World Bank, Global Gas Flaring Data (flaring data by country)
- World Bank, Global Gas Flaring Tracker Report (June 2024, 2023 data, PDF)
- World Bank, Zero Routine Flaring by 2030 initiative (Q&A)
- World Bank, flaring/venting regulation, Nigeria factsheet
- Down To Earth, summary of the WB 2024 report (389 Mt CO2e, 162 bcm Africa)
- Nairametrics, Nigeria records second-highest global increase in flaring in 2024
- Guardian Nigeria, Nigerian flaring up 12% despite oil growth
- Environmental Defense Fund (EDF), summary of the Global Gas Flaring Tracker (intensity, 91.1% efficiency)
- Managing Ghana, Ghana flared 28.5 bcf of gas in 2024
- Ecofin Agency, Ghana aims to stop routine flaring by 2026
- S&P Global Commodity Insights, Iran overtakes Iraq as world's 2nd flarer (2023)