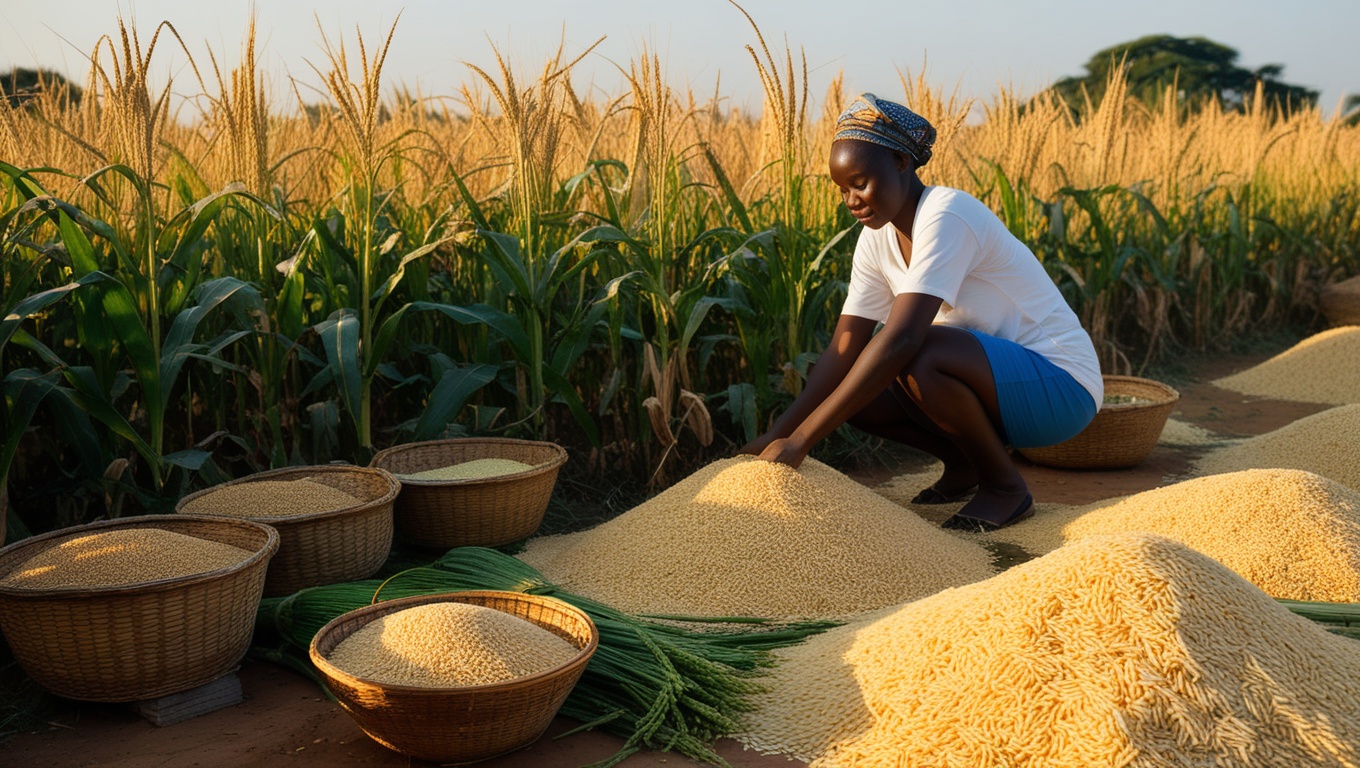
Climate and Sahelian agriculture: measuring vulnerability to adapt better
In the Sahel, the climate is not changing at the same pace as elsewhere: the region is warming about 1.5 times faster than the global average, and the IPCC projections used by the Sahel Alliance point to a gain of at least 2 °C as early as 2021-2040. Yet more than 80% of its population depends on rainfed agriculture with no buffer, meaning an income and a food supply suspended from the sky. This asymmetry, an accelerated climate forcing on some of the world's least-equipped systems, is already producing its effects: across West Africa and the Sahel (15 countries), acute food insecurity has settled at a crisis plateau, with about 55 million people projected for the June-August 2024 lean season, 41.8 million over October-December 2025 and up to 52.8 million expected for the 2026 lean season. Behind these averages lies a deeply uneven geography of risk. It is precisely this granularity that adaptation policies most often overlook, and it is what decides their effectiveness.
A vulnerability that first shows up in the rain
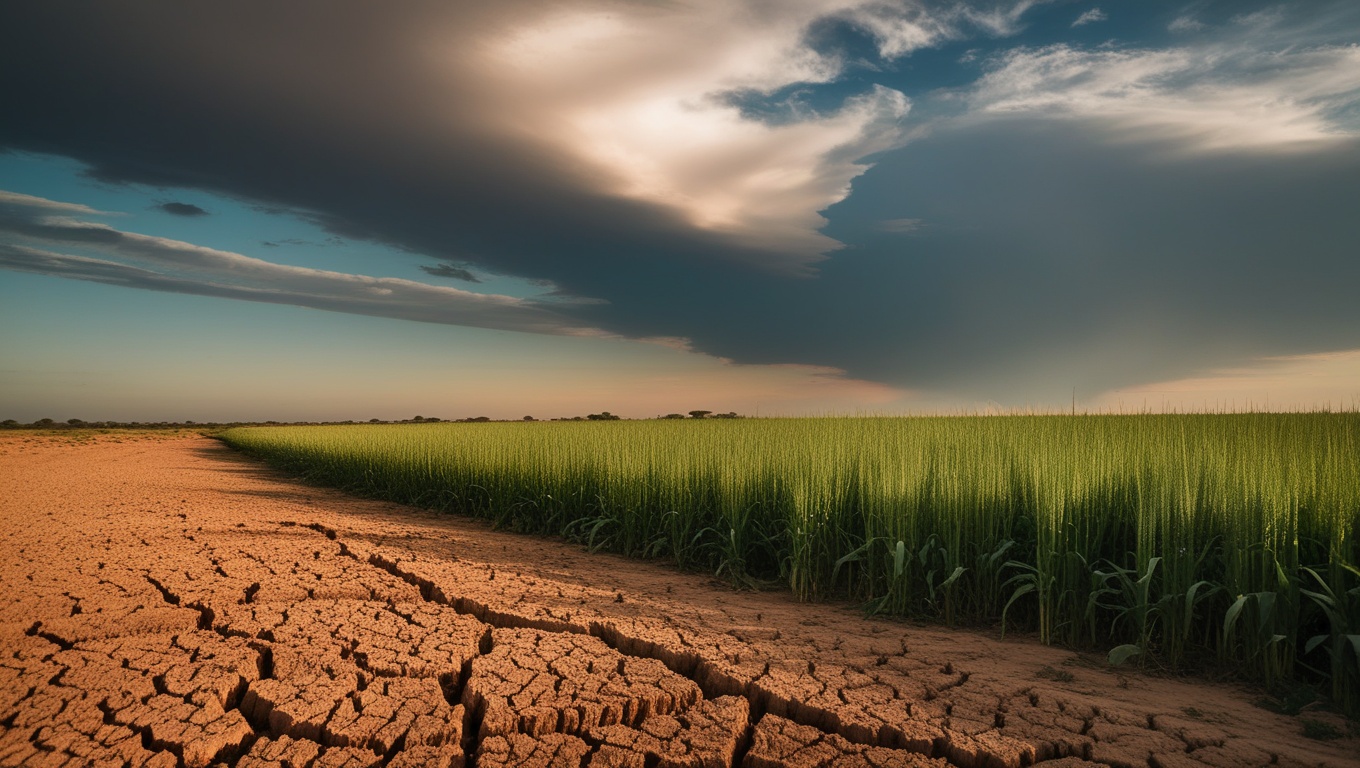
The first variable of Sahelian vulnerability is the scarcity and irregularity of water. The rainfall gaps between the coastal Gulf of Guinea belt and the Sahelian interior are staggering. Where Côte d'Ivoire receives 1,348 mm a year and Benin 1,039 mm, Mali falls to 282 mm and Niger to just 151 mm (2022 data, World Bank). Niger thus receives nearly seven times less rain than Benin for farming systems that are just as dependent on the sky. This chronic water deficit sets a low ceiling on yields and amplifies every poor season: on soil already at its threshold, a rainfall variation that would go unnoticed on the coast translates, in the north, into a lost harvest.
Warming is not a fate shared equally
It is tempting to read the Sahelian crisis as a mere consequence of global disruption, endured the same way everywhere. The data say otherwise. The Sahel is warming about one and a half times faster than the global average, even though it accounts for a marginal share of world emissions. This divergence of trajectories is the most instructive angle: the global climate serves as a reference, but what determines local vulnerability is the gap from that reference. Setting the global curve against the Sahelian curve makes visible a scissor effect, a forcing that accelerates on economies whose capacity to absorb it barely improves. It is also proof that the challenge is not only to mitigate (cut emissions) but to adapt, here and now, where the shock hits hardest.
When heat and erratic rain become a food shock
Water scarcity alone no longer describes the risk. The extreme heatwave at the end of Ramadan 2024, which the World Weather Attribution analysis links directly to climate change, illustrates a new regime of combined shocks: droughts, heatwaves and increased rainfall variability hitting already fragile populations. On rainfed systems with no buffer, these shocks turn almost mechanically into a food crisis. The curve of regional acute food insecurity bears the mark of this: stuck for several seasons at a high plateau (on the order of 50 million people at each lean season), it reflects a crisis that structural factors alone cannot explain. The Global Report on Food Crises 2025 confirms the scale of the shift at the continental level: more than 295 million people experienced acute hunger worldwide in 2024, 13.7 million more than in 2023, and West Africa and the Sahel account for a growing share of this deterioration.
Breaking down the risk: what turns a hazard into a crisis
To act, we must stop speaking of vulnerability as a single block and isolate its drivers. Sahelian agro-climatic vulnerability is not a state; it is the product of several mechanisms that reinforce one another. Four dominate. First, physical exposure, that is the rainfall deficit and heat stress already described. Then dependence, with more than 80% of the workforce hanging on rainfed agriculture, with no irrigation to cushion a dry season. Next comes the sensitivity of cropping systems, whose yields remain far below their agronomic potential. Finally, the weak response capacity of households, with little insurance and savings, for whom a failed harvest immediately means a cut in food. Each of these drivers calls for a different lever of action, which is why conflating them leads to mistargeting the spending.
- Physical exposure: chronic water deficit (151 mm/year in Niger, 282 mm in Mali) and warming 1.5 times faster than the global average.
- Dependence: more than 80% of the population lives from rainfed agriculture, with no irrigation buffer or large-scale water storage.
- Agronomic sensitivity: in sub-Saharan Africa, actual yields remain below 25% of attainable potential, and the rainfed maize yield gap ranges from 70% to 90% (Frontiers in Agronomy, 2025).
- Limited response capacity: low coverage by social safety nets and index-based insurance, leaving households to absorb the shock alone.
The hidden reserve: only a quarter of the potential
The most striking figure is not the one about the crisis; it is the one about the untapped margin. In sub-Saharan Africa, the current yield level represents less than 25% of attainable potential, and for rainfed maize, the region's leading cereal output, the gap between actual and potential yield reaches 70% to 90%. In other words, at constant climate and without a single extra drop of rain from the sky, most of the progress still lies ahead. This reserve is the agronomic translation of underinvestment: poorly improved varieties, depleted soil fertility, limited access to groundwater. The World Bank estimates that the reasoned use of groundwater resources can raise yields by up to 50%. Sahelian vulnerability is therefore not only an exposure endured; it is also a potential left uncaptured, and it is this second reading that opens the space for action.
No adaptation policy is sturdier than the vulnerability data on which it rests.
The cost of inaction: what is lost by not measuring
Failing to adapt has a price, and it is already being paid. According to the World Meteorological Organization, African countries lose on average 2 to 5% of GDP each year because of the climate; the African Development Bank goes further, putting the figure at 5 to 15% of GDP-per-capita growth foregone to climate impacts. By 2030, climate change could push up to 40 million additional Africans into extreme poverty, and yields of staple crops (maize, wheat, millet) could fall by 20% to 30% by 2050 if nothing changes. For a region where farm income is the only income, these percentages are not macroeconomic abstractions: they read as skipped meals, livestock sold off cheaply, dropouts and departures. The Global Report on Food Crises 2025 put at 16.3 million the number of children at risk of acute malnutrition, including 5 million in its severe form, across the area analyzed. Inaction is not a neutral choice; it is a deferred and inflated expense.
The financing gap compounds the risk. Africa captures only about 3% of global climate finance, and adaptation flows there stood at around 11.4 billion USD a year over 2019-2020, while the median cost of adaptation for sub-Saharan Africa alone is estimated at about 46 billion USD a year over 2021-2030 (UNEP). Every dollar not invested today in resilience is a multiple to be disbursed tomorrow in humanitarian emergency. The question is therefore not whether we will pay, but when and at what rate.
The money follows, but the targeting lacks a compass
Funding exists and is scaling up. According to the World Bank Results Brief, 10.2 million people were food insecure in the G5 Sahel countries alone (Burkina Faso, Chad, Mali, Mauritania, Niger) over June-August 2023, and for its food and nutrition security programs in the Sahel and the Horn of Africa, the World Bank records on the order of 923.8 million USD mobilized, including about 422.5 million in emergency measures and 82 million for rapid-response mechanisms, all anchored to a Food Systems Resilience Program of 2.4 billion USD. The Sahel Alliance, for its part, devotes 23% of its portfolio to agriculture, more than 6 billion euros out of 26.4 billion. The challenge is therefore not so much the existence of resources as their targeting. Without a fine-grained vulnerability diagnosis, the risk is to sprinkle emergency aid where sustained investment is needed, and vice versa. The distinction carries heavy consequences: the emergency share funds immediate survival and evaporates within a season, whereas the sustained-investment share builds the resilience that reduces future emergency needs. Arbitrating between the two without data amounts to flying blind with a budget counted in hundreds of millions. That is precisely the gap that territorialized data can close.
What averages hide: the CRAD angle
All the data used here share one limit: they are national or regional averages. Yet vulnerability is not distributed uniformly within a country. An average of 282 mm in Mali aggregates Sahelian lands at 150 mm and Sudanian zones above 700 mm; a national food-insecurity rate smooths over localized pockets of crisis and spared municipalities. Deciding on the basis of the average is a guaranteed way to over-resource some and under-protect others. The added value of a research firm like CRAD lies precisely there: bringing the measurement scale down to the municipality and the household, geo-referencing the water deficit, heat stress and response capacity, then reconstructing a vulnerability map that says not that the Sahel is suffering, but where, how much and why. It is this disaggregation that changes the decision: it turns an undifferentiated envelope into an argued allocation, and a policy objective into a verifiable action plan.
This demand for fineness also applies to gender. Climate shocks do not strike men and women in the same way: rural women, often on the front line for the household's water and food but less endowed with land, inputs and access to credit, absorb a disproportionate share of the shock. Gender-blind vulnerability data miss this asymmetry and miscalibrate their responses: a social transfer paid to the head of household does not mechanically reach the women who manage daily food. Measuring vulnerability therefore also means disaggregating it by sex, a precondition for social safety nets and index-based insurance to actually reach those who need them most, and then for verifying afterwards, figures in hand, that the aid produced the expected effect.
Measure to adapt: method over incantation
Adapting Sahelian agriculture first requires mapping vulnerability at the right resolution, by combining rainfall deficits, heat stress, dependence on rainfed farming and household response capacity. It is this diagnosis that then makes it possible to make trade-offs: where to prioritize groundwater, whose use can raise yields by up to 50% according to the World Bank; where to introduce drought-tolerant varieties; where to deploy social safety nets and climate insurance first. Data is not a nice-to-have; it is the tool that turns a financial envelope into measurable impact on the ground. Between an adaptation policy steered by the average and one steered by disaggregated data, the gap is not one of nuance: it is the difference between spending and obtaining a result.
Key takeaways
- The Sahel is warming about 1.5 times faster than the global average (at least +2 °C as early as 2021-2040 per the IPCC), while more than 80% of its population depends on rainfed agriculture: maximum exposure combined with extreme dependence.
- On a constant perimeter (West Africa and the Sahel, 15 countries), acute food insecurity remains on a crisis plateau: about 55 million people at the June-August 2024 lean season, 41.8 million over October-December 2025 and up to 52.8 million projected for the 2026 lean season.
- The reserve is vast: in sub-Saharan Africa, actual yields remain below 25% of attainable potential, and groundwater can raise yields by up to 50%.
- Inaction is costly: 2 to 5% of GDP lost each year (WMO), up to 40 million Africans pushed into extreme poverty by 2030, and staple yields falling 20% to 30% by 2050.
- Funding exists (923.8 million USD from the World Bank, more than 6 billion euros from the Sahel Alliance) but Africa captures only 3% of global climate finance: effectiveness now depends on targeting through disaggregated vulnerability data.
Recommendations to West African decision-makers
- Build a harmonized system for measuring agro-climatic vulnerability, combining rainfall, heat stress, rainfed dependence and response capacity, at the scale of the most exposed territories (Niger at 151 mm, Mali at 282 mm as priorities).
- Bring the measurement scale down to the municipality and household and geo-reference vulnerability, to move from allocation by national average to argued allocation, pocket of crisis by pocket of crisis.
- Invest in water management and the reasoned use of groundwater resources (yield gains of up to 50%), reserving irrigation for the zones of chronic water deficit identified by the data.
- Close the yield reserve (actual below 25% of potential) through drought-tolerant varieties and soil-fertility restoration, tracking real performance season after season.
- Strengthen social safety nets and index-based climate insurance, disaggregated by sex and triggered automatically by objectively measured rainfall and heat thresholds.
- Coordinate responses at the regional level (ECOWAS, Sahel Alliance) to harmonize indicators, capture a larger share of global climate finance and steer already-mobilized funding toward cross-border shocks.
Sources
- World Bank, Precipitation indicator AG.LND.PRCP.MM
- World Bank, Results Brief, food and nutrition security in the Sahel and the Horn of Africa (10.2 M G5 Sahel, June-August 2023)
- FAO, West Africa and the Sahel, acute food insecurity (41.8 M in Oct-Dec 2025, 52.8 M projected for the 2026 lean season, 15 countries)
- FAO, worsening hunger in West and Central Africa (nearly 55 M at the June-August 2024 lean season, March 2024 Cadre Harmonisé, CILSS)
- Global Report on Food Crises 2025
- World Weather Attribution, April 2024 Sahel heatwave
- World Bank, groundwater and climate resilience in the Sahel
- Sahel Alliance, the Sahel and the challenges of climate change
- Frontiers in Agronomy (2025), closing the yield gap in sub-Saharan Africa
- ORF, financing climate adaptation in Africa (WMO, AfDB, UNEP)
- African Leadership Magazine, what delayed climate adaptation could mean for Africa's GDP