Irrigation: taking agriculture out of the rainfall lottery
In West Africa, each year's harvest turns on a single bet: the rains. Across the continent, roughly 95% of farms depend entirely on rainfall (Malabo Montpellier Panel), and Sub-Saharan Africa irrigates only 3.8% of its cropland, against 46% in South Asia (FAO AQUASTAT). This figure is not one statistic among many: it says that an entire region has delegated its food security to the calendar of the sky. Yet the water is there. The continent holds an irrigable potential estimated at 42.5 million hectares and has developed only a third of it. The real question is therefore not whether West Africa can master its water, but whether it decides to do so, and above all whether it already knows where, how and how much.
A gap best measured by the dozen
The scale of the shortfall is obvious the moment you compare. According to FAO AQUASTAT's 2022 data, Sub-Saharan Africa equips 3.8% of its cropland for irrigation, while South Asia irrigates 46% and the world average stands at 23%. In other words, the region irrigates about twelve times less than South Asia and six times less than the global average. This is not a difference of degree, it is a difference of kind: where other regions have made water control the foundation of their agriculture, West Africa still treats it as a marginal supplement. Rainfed farming is not one technique among others here, it is the dominant, almost exclusive regime, and it imposes its logic on the entire production chain, from the choice of seed to the timing of fieldwork.
This lag takes on particular weight when you recall that, worldwide, 72% of the water withdrawn is destined for agriculture (FAO AQUASTAT, 2022). Irrigation is not a secondary sectoral issue: it is the single largest use of water on the planet. A region that barely irrigates is therefore not saving a resource, it is forgoing a lever. It lets climate variability arbitrate its harvests in its place. And that arbitration is hardening: under an increasingly erratic rainfall regime, the absence of water control does not freeze a status quo, it turns every dry year into a direct threat to food availability.
What irrigation really changes
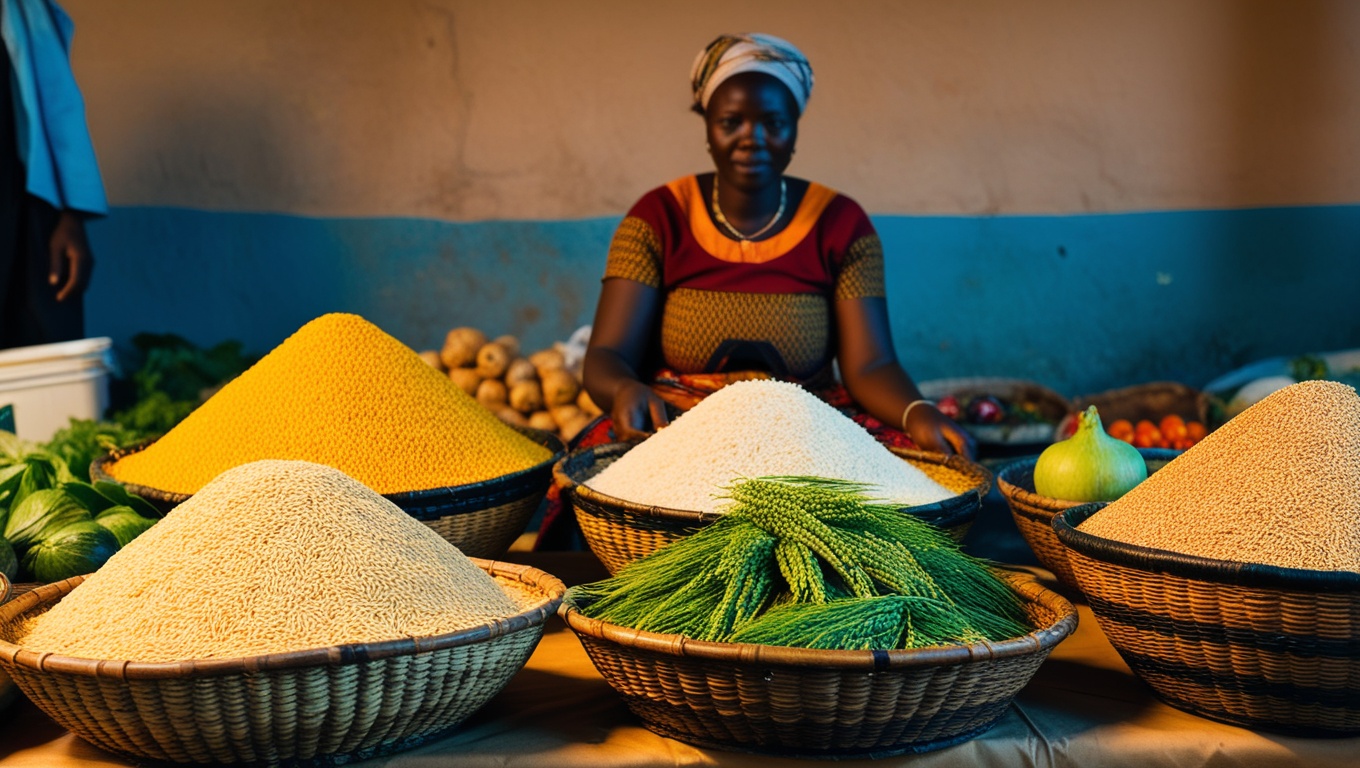
The mechanism is simple and powerful. Irrigation decouples yields from rainfall risk: it secures planting at the start of the season, it allows a second or even a third crop in the year where rainfall permitted only one, and it stabilizes farm incomes by freeing them from the calendar of the seasons. Where rainfed farming imposes an agriculture with a single chance per year, water control turns the plot into a productive tool all year round. The gain is not only quantitative: an irrigated plot allows higher value-added crops (market gardening, off-season production) that remain out of reach for a system tied to the rains, and thereby diversifies the rural household's income.
The price of this lack of control can be read in the yields. Niger, whose agriculture is almost entirely rainfed, posts a cereal yield of 577 kg/ha (World Bank, 2024), the lowest of the nine reference countries. Ghana, at the other end, reaches 2,688 kg/ha (2023), nearly five times more. Neither country suffers from an exceptional climate: what separates them stems first and foremost from the ability to secure water and the other factors of production. Yield is not a gift from the sky, it is a variable of public policy. The cereal ranking does not, moreover, map onto the rainfall chart: neighbouring countries with comparable soils and rainfall sit at both extremes, which finishes off the climatic explanation.
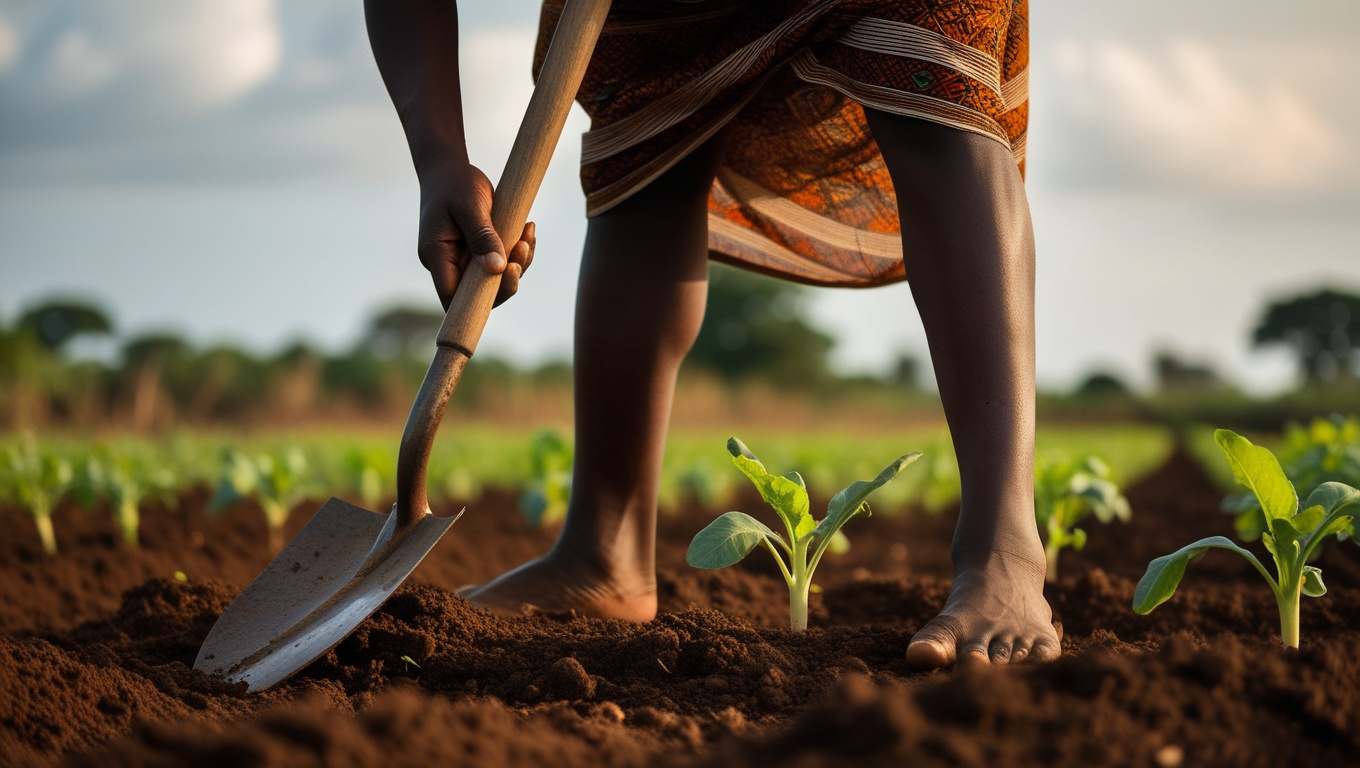
Roughly 95% of African farms depend entirely on rainfall. Each year, the harvest is decided by the timing and abundance of the rains, not by a managed resource.
A dormant potential, two-thirds untapped
The West African paradox is not a shortage of water, it is a failure to develop it. Africa holds an irrigable potential estimated at 42.5 million hectares, of which only 13.3 million have been developed, about 31% (FAO AQUASTAT, Wilson Center). Nearly two-thirds of the potential therefore remain untapped. It is not a physical constraint that blocks the region, it is an investment decision that was not taken, or not kept. The continent does not run up against the scarcity of the resource: it runs up against development, that is, the infrastructure, the financing and the governance that turn available water into water available at the plot, at the right moment.
The slowness of development is visible over the long run. The continent's irrigated area rose from 7.4 million hectares in 1960 to 13.3 million in 2007 (FAO, Wilson Center), a near-doubling over half a century. Measured against the potential, this pace remains modest: at this rate, closing the gap would take several generations. The World Bank nonetheless estimates that Sub-Saharan Africa's arid zones alone offer, depending on the cost of the technologies deployed, an irrigable expansion potential of 6 to 14 million additional hectares. The reserve is there, quantified, within reach of investment. It is worth measuring what such a pace tells us: while Africa added barely six million hectares in fifty years, Asia made irrigation the pillar of a green revolution that more than doubled its yields in a single generation.
What the regional average hides
As always, the regional average conceals contrasts that public action cannot ignore. Two countries account for most of West Africa's developed schemes: Nigeria, with 293,117 hectares equipped, and Mali, with 235,791 hectares thanks to the historic Office du Niger system. At the other extreme, Togo (about 7,300 hectares) and Benin (12,258 hectares) remain far behind. Between Nigeria and Togo, the ratio exceeds forty to one. Talking about irrigation in West Africa without distinguishing these situations is to conflate a country that has built infrastructure with a country that has developed almost nothing. The practical consequence is immediate: a uniform regional policy makes no sense when starting points range from one to forty, and when the same euro invested does not produce the same effect depending on whether it rehabilitates a large Malian scheme or launches a first Beninese network.
These figures call for a methodological caveat, which is also the heart of the craft. The AQUASTAT profiles rest on old and heterogeneous reference years (Nigeria and Niger around 2004-2005, Mali and Ghana around 2000, Benin and Senegal around 2002). These are dated orders of magnitude, not 2024 values, and the area actually developed today may be higher. The Togo figure, in particular, remains an estimate to be confirmed. This uncertainty is not an expert's detail: it means that some regional investment decisions are being taken on data twenty years old. An irrigation plan built on such figures is not only wrong about the scale of the lag, it is potentially wrong about its geography, and therefore about the countries and areas where public money would be most useful.
Building is not enough: the gap between equipped and irrigated
West Africa's lag is not just a construction deficit. A more insidious problem compounds it: the developed schemes are largely underused. In Benin, out of 12,258 hectares equipped for irrigation, only 7,131 were actually irrigated in 2005, a gap of 42%. In other words, nearly half of the existing infrastructure produces nothing. The phenomenon recurs elsewhere in the region and points to a challenge of maintenance and governance, not only of initial investment. A scheme is not a structure you inaugurate once and for all: it is a living system, made of pumps, canals and users, that deteriorates as soon as upkeep stops.
This gap changes the nature of the problem. It is not enough to finance dams, canals and pumping stations: the structure still has to work, the water has to reach the plot, users have to maintain it and local governance has to ensure its durability. An abandoned scheme costs twice, in construction and then in lost output. The productivity of irrigation is therefore decided not only at the inauguration, but in the years that follow, when the cameras have already left. This is also why a franc spent rehabilitating an existing scheme often yields more than a franc committed to a new structure: the resource and the land are already there, only the return to service is missing.
Africa against the rest of the world: a historic decline
The lag is not recent, it is structural. The historical AQUASTAT data, drawn on by the Malabo Montpellier Panel, put the share of irrigated land at about 37% in Asia and 14% in Latin America, against 6% for Africa as a whole (including North Africa, which pulls the average up). The Sub-Saharan sub-continent, taken alone, falls to 3.8%. This gap set in over several decades, while the Asian green revolution made water control one of its pillars. Africa's lag is therefore not the result of a passing accident or of climatic bad luck: it is the cumulative product of repeated budget choices, year after year, that placed irrigation far down the order of public priorities.
A word of caution is needed on these comparisons. AQUASTAT vintages diverge depending on the geographic scope and the year retained: the same South Asia is given as 46% by AQUASTAT 2025 and 39% by other references, and Africa swings between 3.8% (Sub-Saharan, 2022) and 6% (whole continent, older data). These discrepancies do not call the finding into question, they confirm it: whatever the vintage, Sub-Saharan Africa remains a global outlier at the bottom. But they are a reminder that a figure without its scope or its year means nothing, a principle that holds for irrigation as for any development indicator.
The cost of inaction: rainfall as the adjustment variable
As long as yields remain tied to the rains, every prolonged dry season is paid for in lost harvests, heightened food insecurity and migratory pressure. Niger's yield of 577 kg/ha is not an accident: it is the quantified translation of an agriculture with almost no safety net against climate variability. And that variability is worsening. Under an increasingly erratic rainfall regime, the absence of irrigation does not maintain a status quo, it exposes the region further every year.
Rainfall dependence has a cumulative economic effect. Where a second annual season would be possible with managed water, rainfed farming allows only one: it is production potential lost every year, without any budget line recording it. Where secured planting would guarantee germination, waiting for the rains risks losing everything if the precipitation is late. The cost of inaction is not a visible expense, it is a harvest that never takes place, one season in two that does not exist.
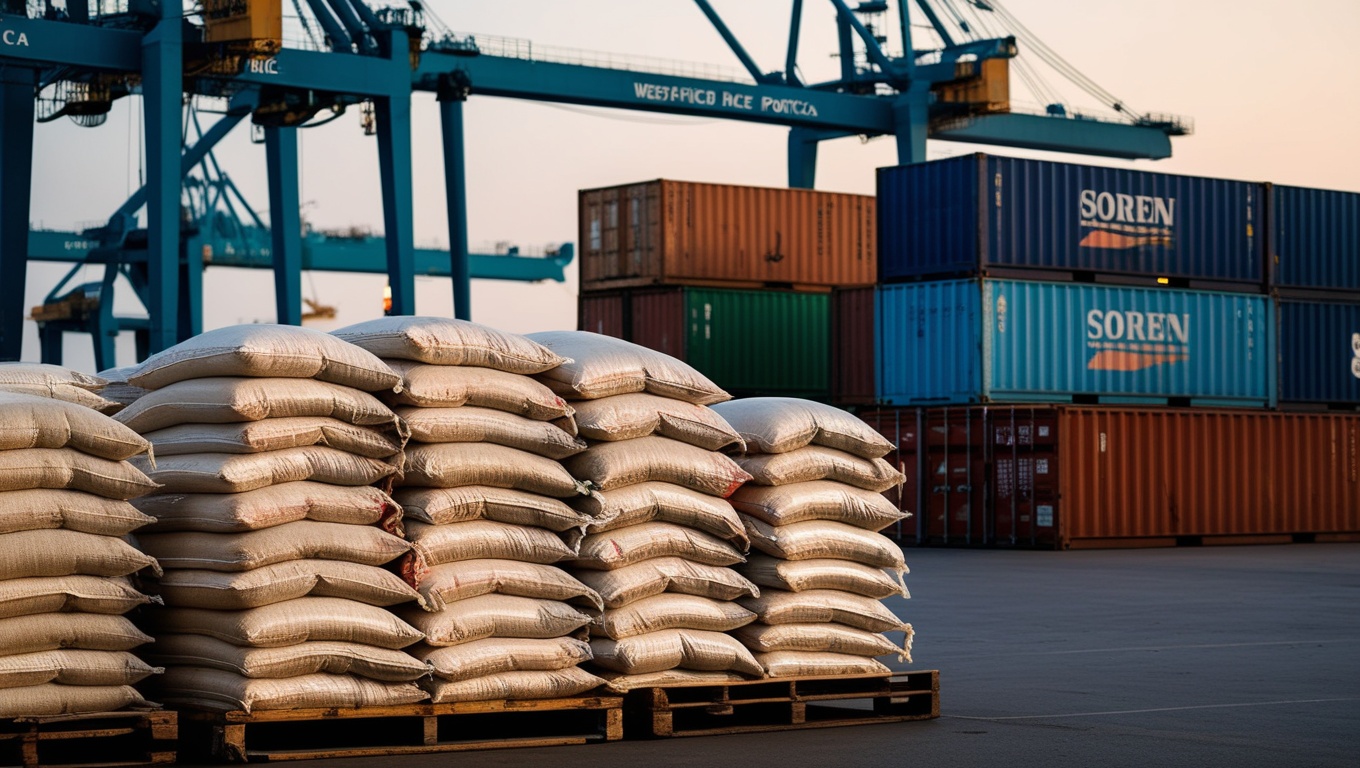
This invisible cost nonetheless has a very visible counterpart in the external accounts. Africa spends more than 35 billion dollars a year on food imports (FAO), a bill that absorbs scarce foreign currency and exposes the continent to the volatility of world prices. Every tonne of cereals not produced for lack of managed water becomes a tonne imported, paid at the international market price and subject to logistical shocks. Developing irrigation, by contrast, allows land productivity to be doubled or tripled, according to the FAO, by permitting several cropping cycles a year. The calculation is therefore twofold: not irrigating costs in lost harvests at home, and in foreign currency spent abroad.
- Securing planting. Without managed water, a delay in the rains jeopardizes germination and can cost an entire season; irrigation guarantees the start of the cycle at the right moment.
- The double, even triple season. Rainfed farming usually allows only one crop a year; managed water makes it possible to work the plot in the dry season, doubling production potential without a single extra hectare.
- Income stability. By freeing production from the rainfall calendar, irrigation smooths farm incomes and reduces rural households' exposure to climate shocks.
- Cutting the import bill. Every tonne produced thanks to managed water is a tonne that does not have to be bought in foreign currency on a volatile world market.
Solar power, the small revolution that changes the financial equation
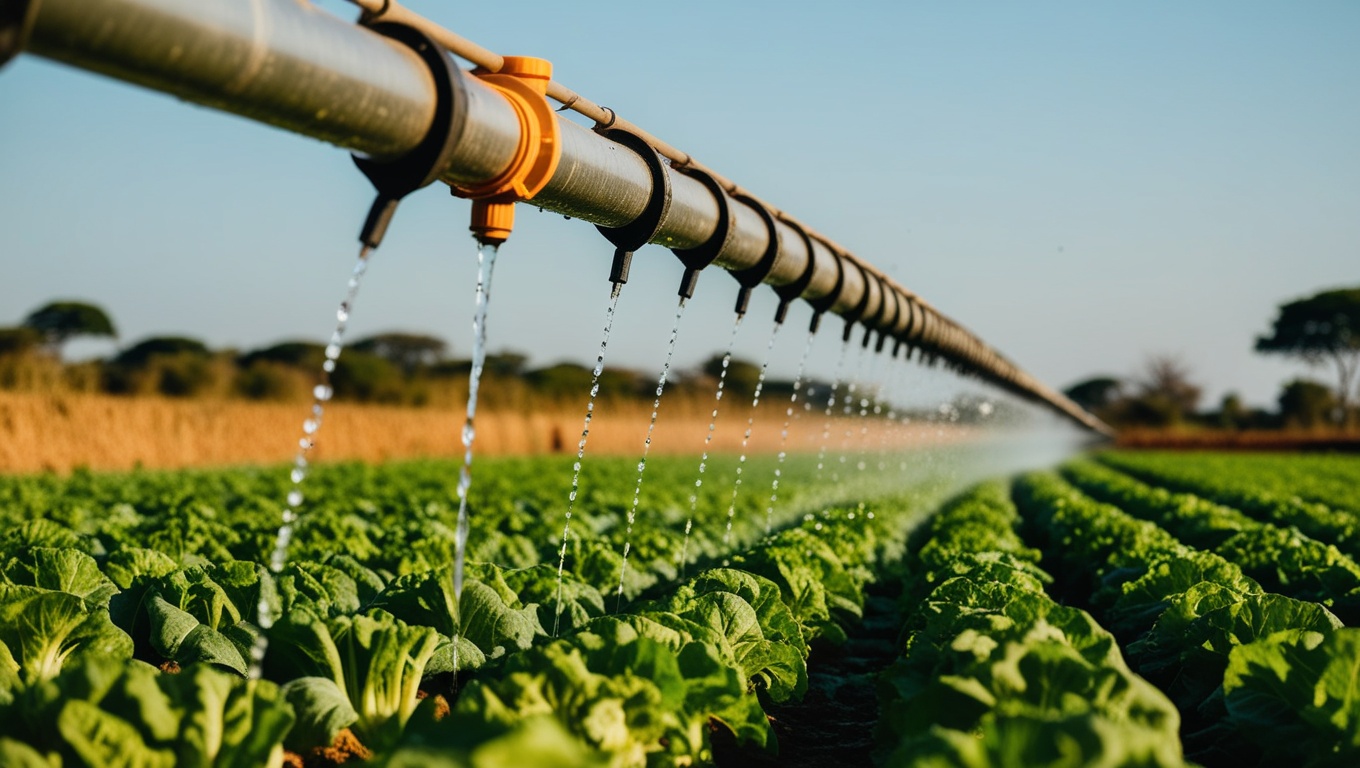
The debate on irrigation was long a prisoner of one image: the large dam and the public scheme, costly, slow to build, hard to maintain. That image is no longer the only one. The fall in the price of photovoltaic panels has given rise to decentralized irrigation, at the scale of the farm, powered by solar pumps that free the producer from fuel and the electricity grid. An IIASA study has quantified this reserve: about 120 million hectares of land would be potentially suited to solar irrigation in Sub-Saharan Africa, of which nearly 25 million for West Africa alone. On their own, these individual photovoltaic installations could cover more than a third of smallholders' crop water needs.
The appeal of solar is not only technical, it is financial. The same study estimates that an annual investment of around 3 billion dollars in small-scale solar irrigation would generate more than 5 billion dollars in annual profits for smallholders, thanks to higher yields. The ratio is favourable, and it shifts the cursor: where the large scheme requires heavy public financing and complex governance, the solar pump belongs to a decentralized model, accessible to the family farm, replicable at scale. This does not make large structures useless, but it changes the trade-off: the same public budget does not irrigate the same area depending on whether it finances concrete or distributed photovoltaics.
This prospect does not remove the need to measure: it demands it. Deploying solar pumps without mapping the groundwater resource risks over-exploiting the aquifers; targeting them without knowing the areas of greatest yield gap wastes the advantage. Solar irrigation is a powerful accelerator, but its effectiveness depends, like that of the large scheme, on a precise field diagnosis. The technology changes the scale and the cost; it does not replace the data.
Gender and financing: two blind spots
Two dimensions remain too often absent from the irrigation debate. The first is financing: the World Bank has shown that the irrigable expansion potential of Sub-Saharan arid zones ranges from 6 to 14 million hectares depending on the cost of the technologies deployed. The technical choice, small-scale individual irrigation, solar boreholes, large schemes, directly determines the number of financeable hectares. The same public budget does not irrigate the same area depending on whether it targets the heavy structure or the decentralized solution: making the trade-off requires knowing, value chain by value chain and area by area, the real return on each franc invested. Yet this costing is missing today from most of the region's agricultural budgets, which reason in structures inaugurated rather than in hectares actually brought under water.
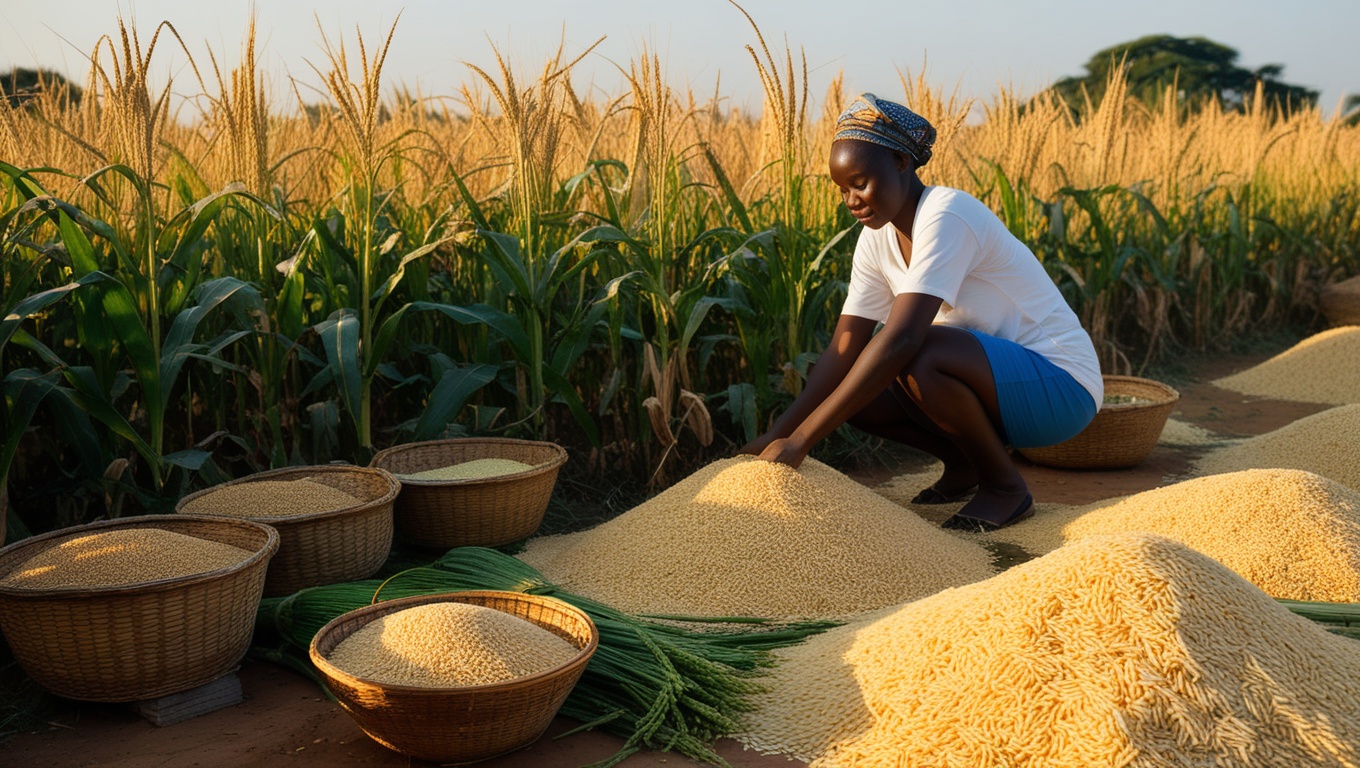
The second dimension is equity of access. The CRAD's experience on the regional WOCEWA project, devoted to gender equality in the sustainable-energy SMEs of ECOWAS, recalled a rule that also holds for agricultural water: without disaggregated data, inequalities in access to infrastructure remain invisible, and therefore never corrected. Knowing who actually accesses the water of the schemes, men or women, supported cooperatives or isolated producers, is a condition for investment to irrigate the farms that need it most, and not only the best endowed. Women carry out a major share of West African farm work but have less access than men to secure land, credit and equipment: a gender-blind irrigation policy mechanically reproduces this gap, equipping first those who were already best placed to capture the resource.
Measure before building: the CRAD angle
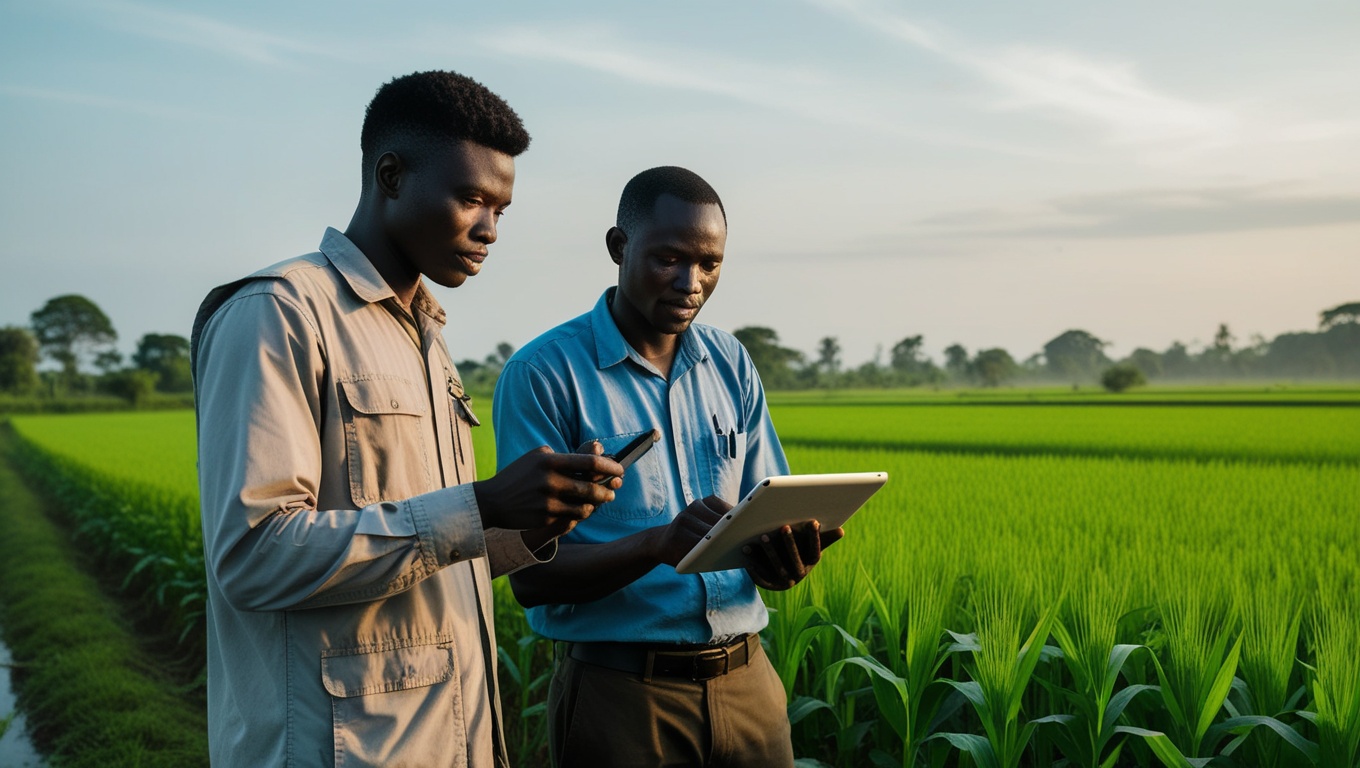
The central lesson of this report is methodological. The priority is not only to build schemes, it is to measure precisely what already exists: how many hectares are actually equipped, how many are effectively irrigated, and why the gap between the two. The Beninese example (7,131 hectares irrigated out of 12,258 equipped) shows that poorly monitored infrastructure squanders the initial investment. Without this diagnosis, the region keeps reasoning on AQUASTAT figures twenty years old and investing blind. Aggregate national data, useful for comparing countries, never says where to act within a country: yet it is there, at the plot and the local level, that the effectiveness of each euro committed is decided.
This is precisely the role the CRAD plays for States and funders: georeferenced field diagnostics, digital data collection that distinguishes the equipped from the actually irrigated, and monitoring and evaluation systems that repeat the measurement season after season. Turning irrigable potential into prioritized and verifiable investment decisions, this is what separates an effective irrigation policy from a succession of structures inaugurated and then forgotten. Data is not an optional extra of the irrigation project: it is its condition for return. Mapping the dormant schemes, measuring actual flows, tracking disaggregated access to water, this is what moves water policy from intention to precision.
Fundamentally, the mastery of agricultural water in West Africa is not an unsolved technical problem: we know how to irrigate, Asia has demonstrated it at scale, and the physical potential exists at 42.5 million hectares. It is a problem of budget priority, of governance of the structures and, above all, of measurement. The countries that will make progress are those that first know how to say, with figures to back it, where water is lacking, where the schemes lie dormant and where each franc will yield the most kilos. Taking agriculture out of the rainfall lottery starts with ceasing to steer blind.
Key takeaways
- Sub-Saharan Africa irrigates only 3.8% of its cropland, against 46% in South Asia and 23% on the world average, and roughly 95% of African farms depend entirely on rainfall.
- Potential is not the brake: of 42.5 million irrigable hectares, only 13.3 are developed (about 31%), and the irrigated area did not double between 1960 and 2007.
- Rainfall dependence shows up in yields (577 kg/ha in Niger against 2,688 in Ghana) and is paid abroad: more than 35 billion dollars in food imports a year for the continent.
- Solar power changes the equation: about 120 million hectares potentially suited to solar irrigation in Sub-Saharan Africa (of which 25 for West Africa), with an estimated return of more than 5 billion dollars in profits for 3 billion invested a year.
- Building is not enough: Benin was actually irrigating only 7,131 ha out of 12,258 equipped (a 42% gap), and the regional average hides sharp contrasts resting on old AQUASTAT data, to be updated through field measurement.
Recommendations for West African decision-makers
- Carry out an up-to-date, georeferenced national inventory of schemes, systematically distinguishing the equipped area from the area actually irrigated, to replace the twenty-year-old AQUASTAT data that today underpins decisions.
- Treat the gap between equipped and irrigated (42% in Benin) as a priority by rehabilitating and maintaining what exists before financing new structures: a scheme returned to service costs less than a new one.
- Integrate small-scale solar irrigation into national plans, drawing on a mapping of aquifers and of areas with a large yield gap, to capture a potential of 25 million hectares in West Africa without over-exploiting the resource.
- Base the technology choice (small-scale irrigation, solar boreholes, large schemes) on the real cost per irrigable hectare, since the financeable potential of arid zones ranges from 6 to 14 million hectares depending on the technology chosen.
- Build the governance and maintenance of schemes from the design stage (water-user associations, financing of upkeep, flow measurement), so that a developed hectare durably becomes a productive hectare.
- Collect disaggregated data on actual access to water (by sex, by farm type, by area) to target investment towards the producers most exposed to rainfall risk, and not only towards those already equipped.
Sources
- FAO AQUASTAT, global information system on water and agriculture
- FAO AQUASTAT, Water Data Snapshot 2025 (UN-Water)
- FAO AQUASTAT, Nigeria country profile
- FAO AQUASTAT, Mali country profile
- FAO AQUASTAT, Senegal country profile
- FAO AQUASTAT, Niger country profile
- FAO AQUASTAT, Benin country profile
- FAO AQUASTAT, Ghana country profile
- World Bank, Cereal yield (kg per hectare), AG.YLD.CREL.KG
- World Bank, Water for Food / Climate-Resilient Irrigation
- Wilson Center, Investing in Irrigation for Agriculture Productivity in Africa
- Malabo Montpellier Panel, Water-Wise: Smart Irrigation Strategies for Africa (2018)
- IIASA, Solar-powered irrigation: a game-changer for small-scale farms in sub-Saharan Africa (2023)
- FAO / FurtherAfrica, Irrigation and Water Management: Africa's Next Agricultural Frontier (2025)